
Grows where the grid hasn’t.
Look before you build
Before anyone pays for a full environmental study, a few hours with open maps can show where a mini-grid or a power line is likely to run into trouble: a protected area, a river crossing, homes in the way. This is our method for that first look, the data it uses, and two worked examples.
Five steps, one page per site
- Draw the footprintA mini-grid site (the generation yard and the village it serves) or a line route. The project type sets the buffers.
- Run the layersEach layer is checked against the footprint and sorted into one of four tiers.
- Report, do not scoreFor each layer: does it touch, how much, and how far is the nearest feature.
- Point to the standardsEach flag names the lender standard it is likely to bring into scope, as a pointer, never a decision.
- State the limitsData dates, gaps, and the questions only a field visit can answer.
What counts as a flag
| Tier | Mini-grid site | Distribution line |
|---|---|---|
| A No-go | Inside a national park or other strict protected area; permanent water; very steep ground; inside an airfield | Crossing a strict protected area or an airfield |
| B Avoid if possible | Inside a multiple-use protected area such as a game management area or forest reserve; buildings on the site; tree cover; recent tree loss nearby; wetland; mapped graves or heritage | Multiple-use protected area crossed; buildings in the right-of-way; km through tree cover, wetland or recent tree loss; graves or heritage within 100 m; steep sections |
| C Caution | Flood zone or seasonal water; moderate slope; frequent bush fire; cropland; a school or clinic within 500 m; a dam, mine or quarry within 2 km; a protected area within 5 km | River, main road and railway crossings; flood zone; moderate slope; frequent bush fire; cropland; a school or clinic within 50 m; near large wetlands (bird risk); an airfield within 3 km |
| D Enablers | Distance to road and grid; land already farmed or built on; people within 2 km | Share along roads or existing lines; land already disturbed; people within 1 km |
Thresholds such as "within 500 m" are our working assumptions, set out in the method note and changed when testing shows they mislead. Lender standards named on each flag: IFC Performance Standards (2012) and the World Bank Environmental and Social Framework.
A made-up mini-grid and a made-up line
Both projects are invented, in places chosen because they are public and typical: dispersed farms in Zambia's Southern Province, and the Shire valley in southern Malawi. Neither is a real project or client site.
1. Mini-grid site, Southern Province, Zambia
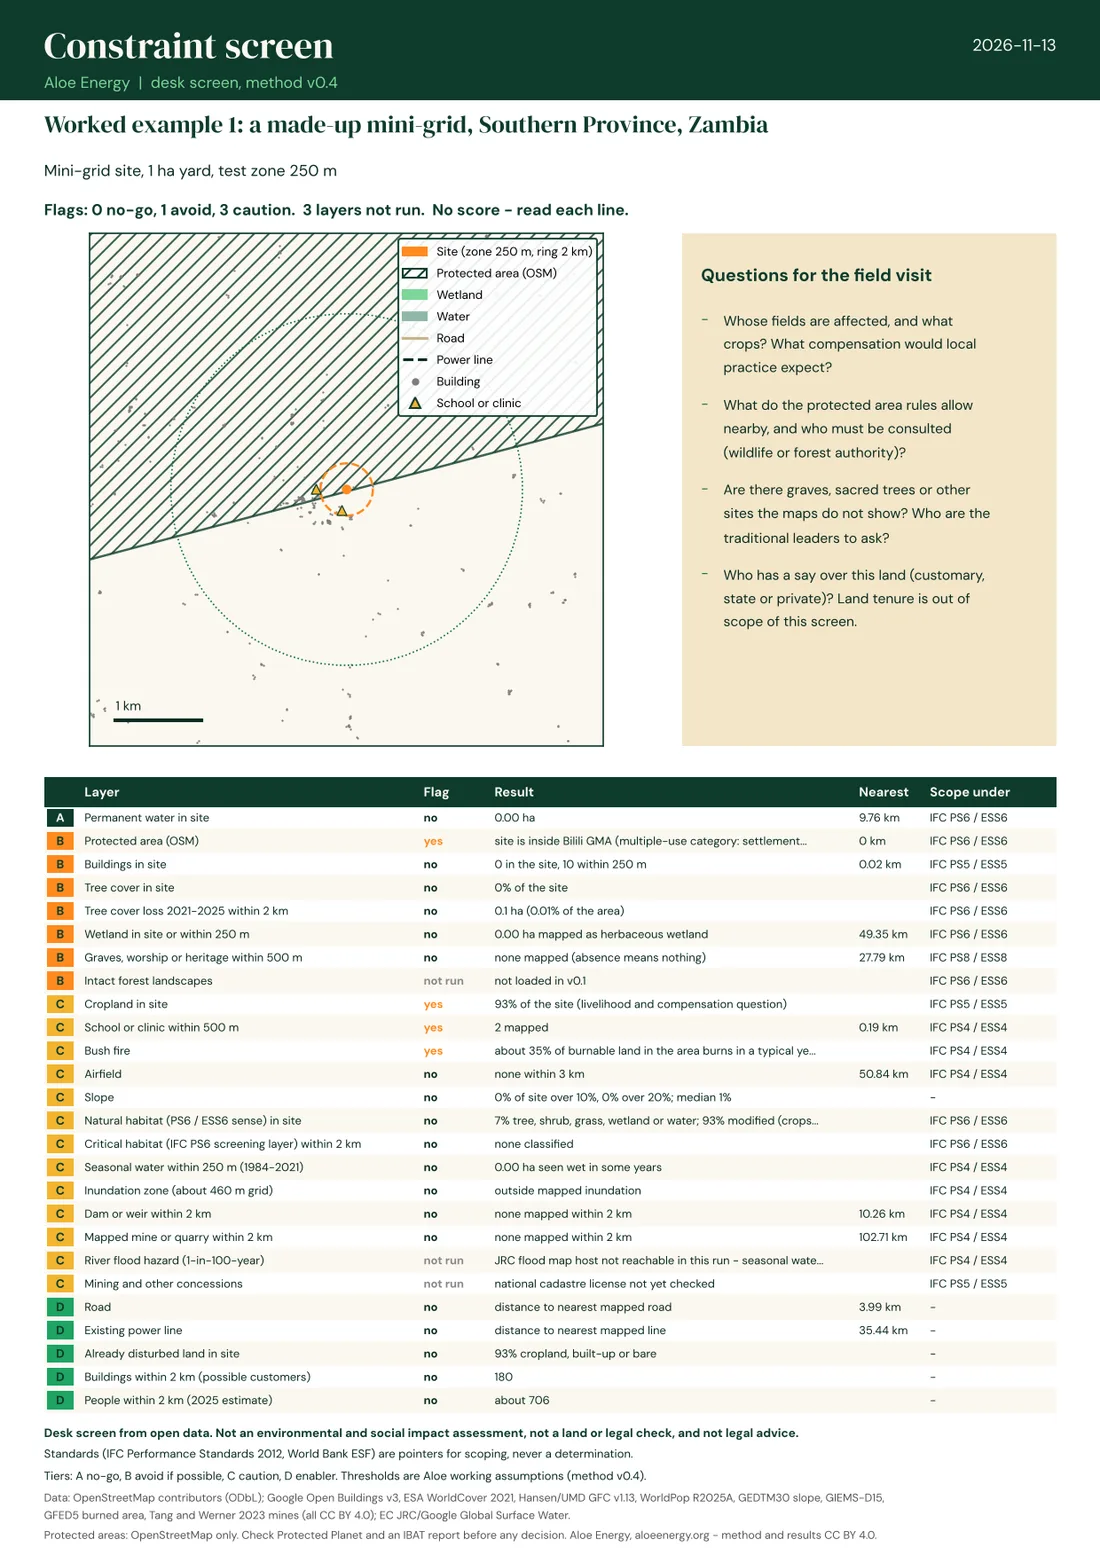
The site sits inside a game management area, where people live and farm. Our first draft called that a no-go; testing showed it should be "avoid if possible, read the management plan". Cropland covers 93% of the yard, about 700 people live within 2 km, and the nearest mapped power line is 35 km away. About a third of the burnable land around it burns in a typical year, so the yard needs a fire break.
2. A 33 kV line, Lower Shire, Malawi
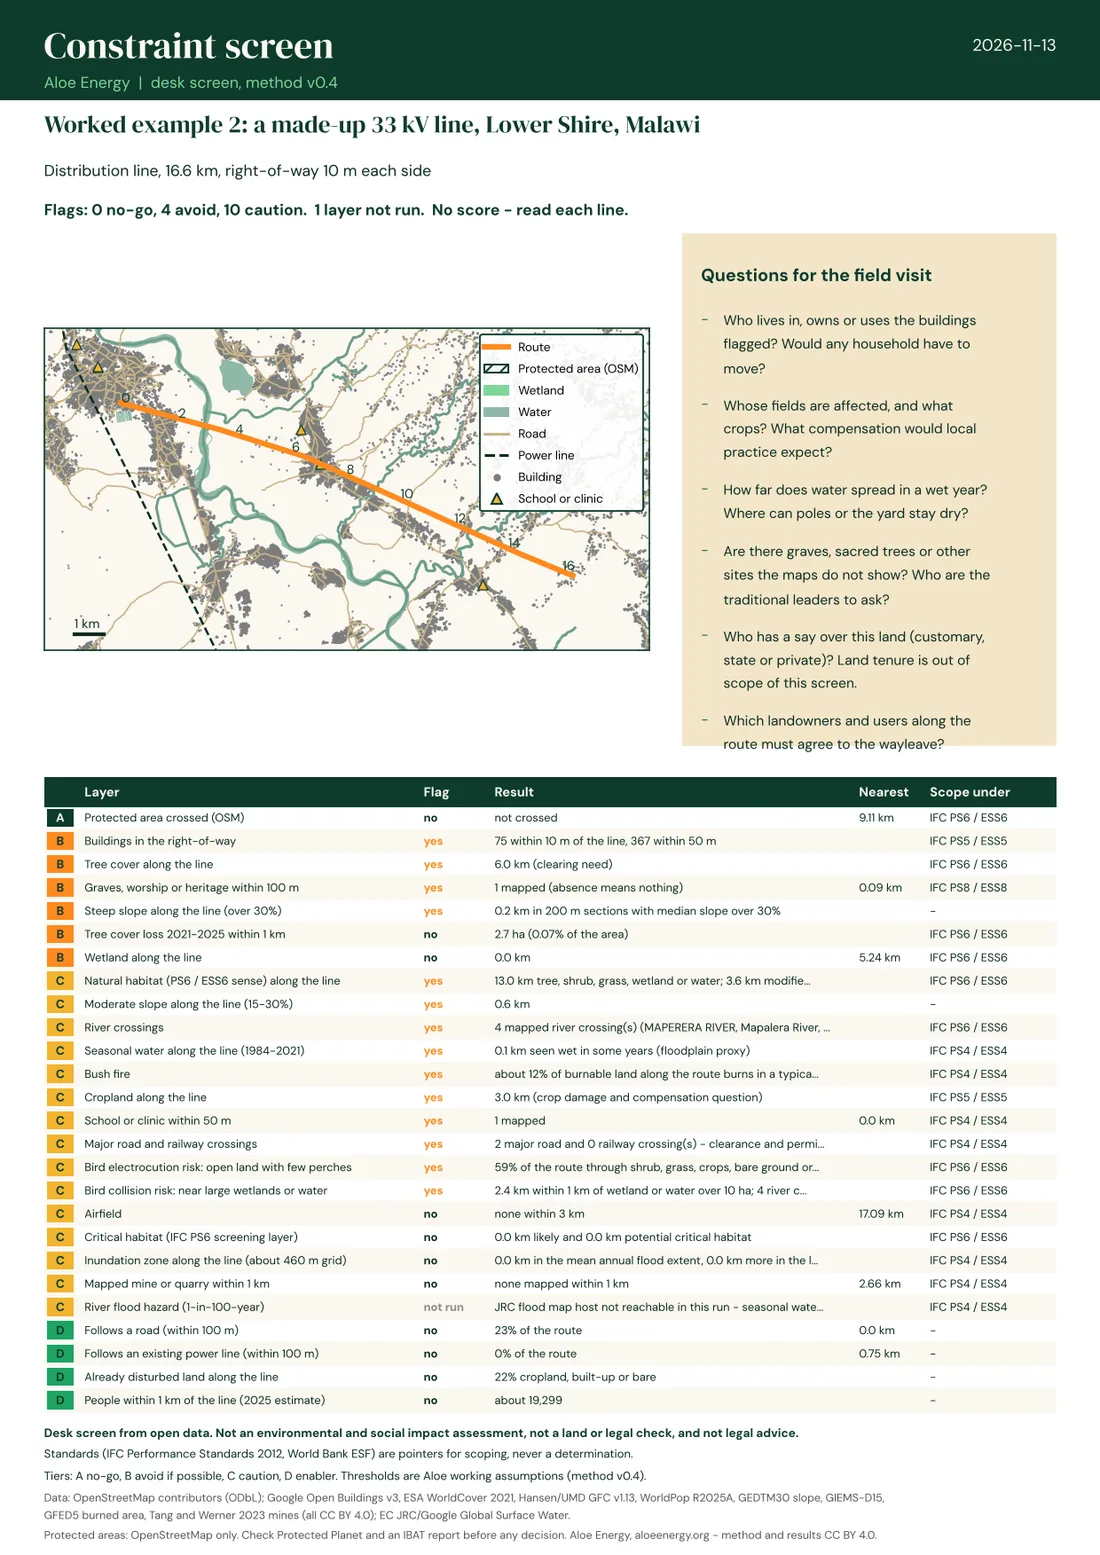
A straight 16.6 km route from an existing line across the Shire. It passes within 10 m of 75 buildings, runs through 6 km of tree cover, crosses four mapped rivers and two main roads, and has about 0.8 km of moderate to steep ground.
Where along the route
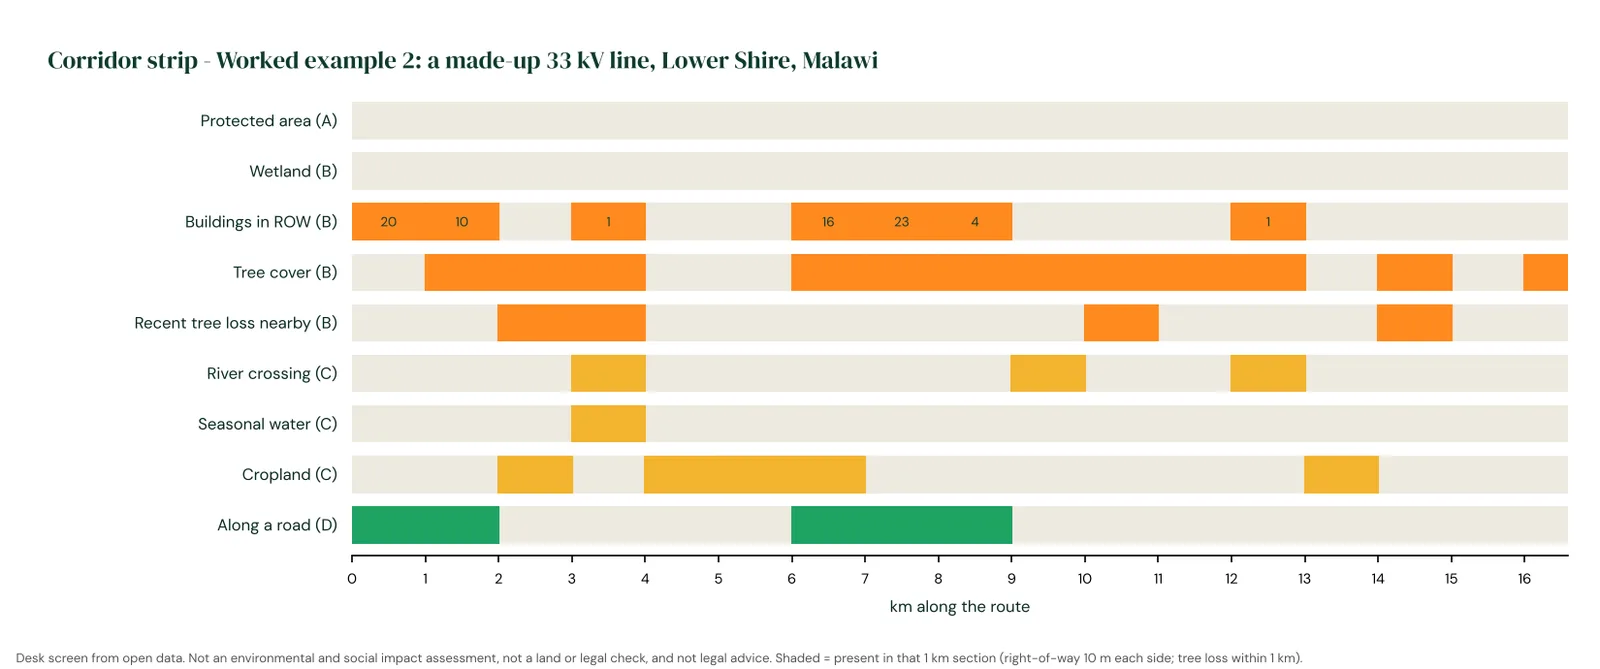
The corridor strip lays the route out by kilometer. Buildings cluster at km 0-2 and 6-9, where the route crosses town; tree cover runs from km 6 to 13.
Two routes, side by side
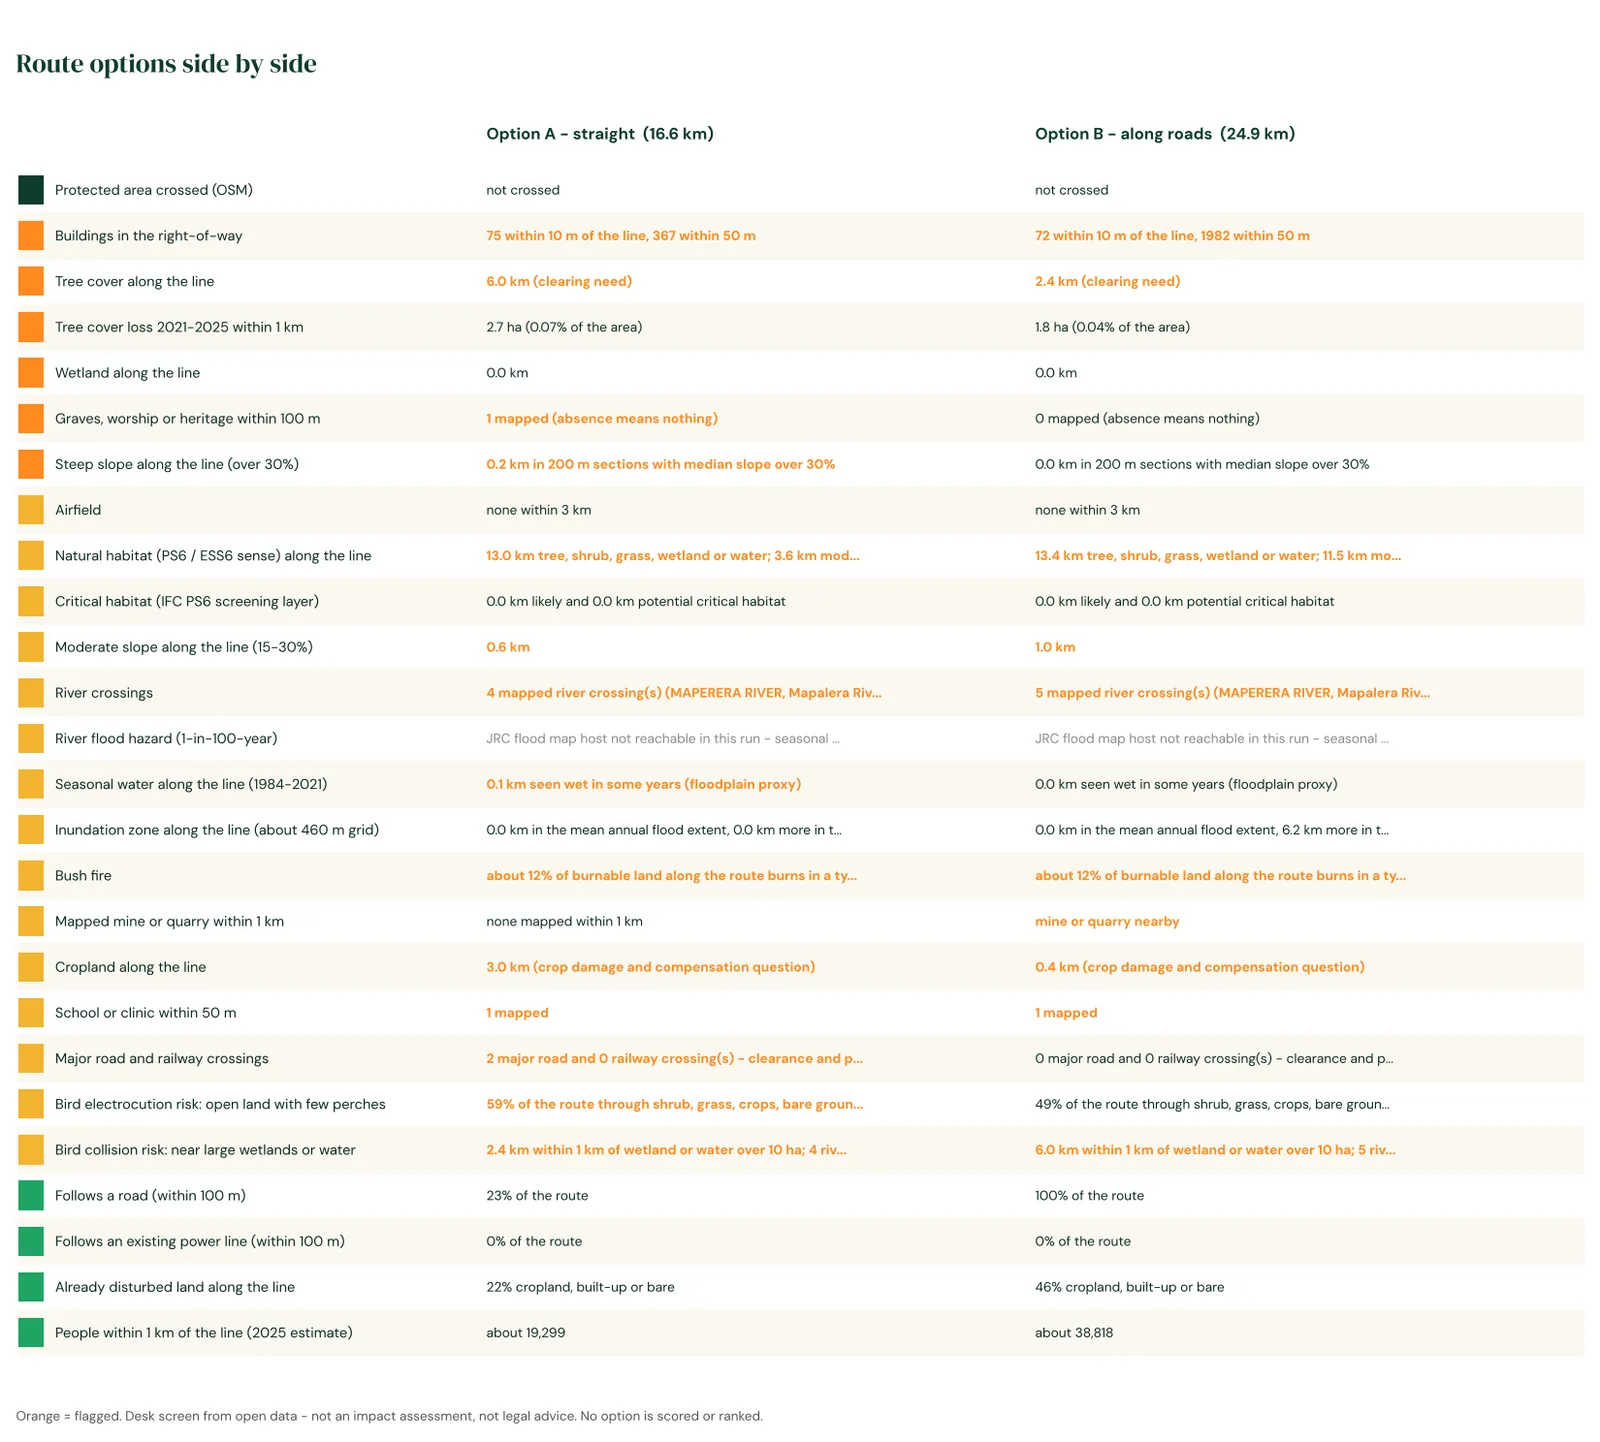
Following the roads adds 8 km but cuts tree clearing from 6.0 to 2.4 km and cropland from 3.0 to 0.4 km. It also brings the line within 50 m of far more homes. A screen does not pick the winner; it shows the trade.
Screening a whole program
Mini-grid programs and tenders rarely start with one site. They start with dozens or hundreds of villages. The same screen runs over all of them: we find candidate villages from building footprints (clusters of 60 to 2,000 buildings), place the generation yard automatically at the nearest open spot to the village center with no building within 60 m, and run every check. The result is a map and a table of flags for each site. Sites are listed by size, never ranked: the color shows the most serious flag, so a team can see at a glance which villages need a closer look and why.
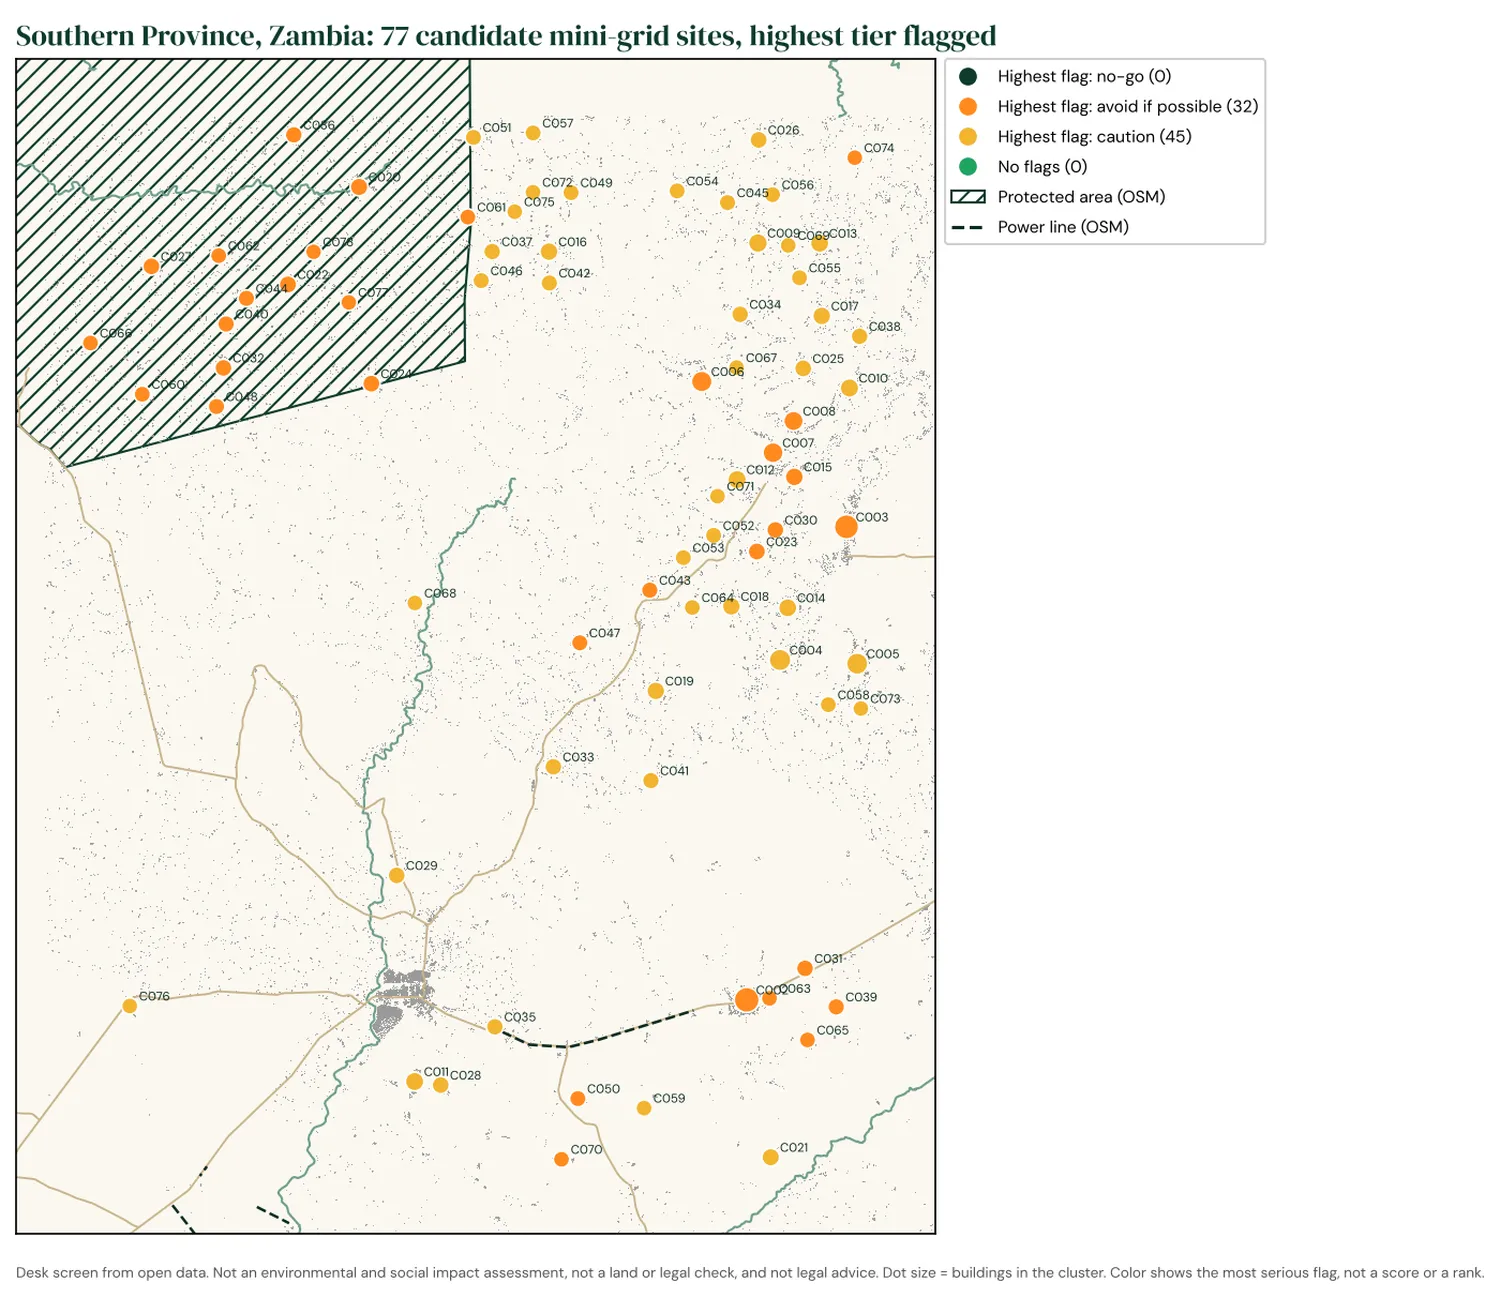
77 candidate villages in part of Zambia's Southern Province, between Kalomo and Choma. None has a no-go flag. 32 have an "avoid if possible" flag: 15 lie inside a game management area, 15 have an active clearing front nearby (recent tree loss above 0.5% of the land within 2 km) and 4 would need tree clearing for the yard. The other 45 carry only caution flags, mostly cropland and bush fire.
All of Malawi
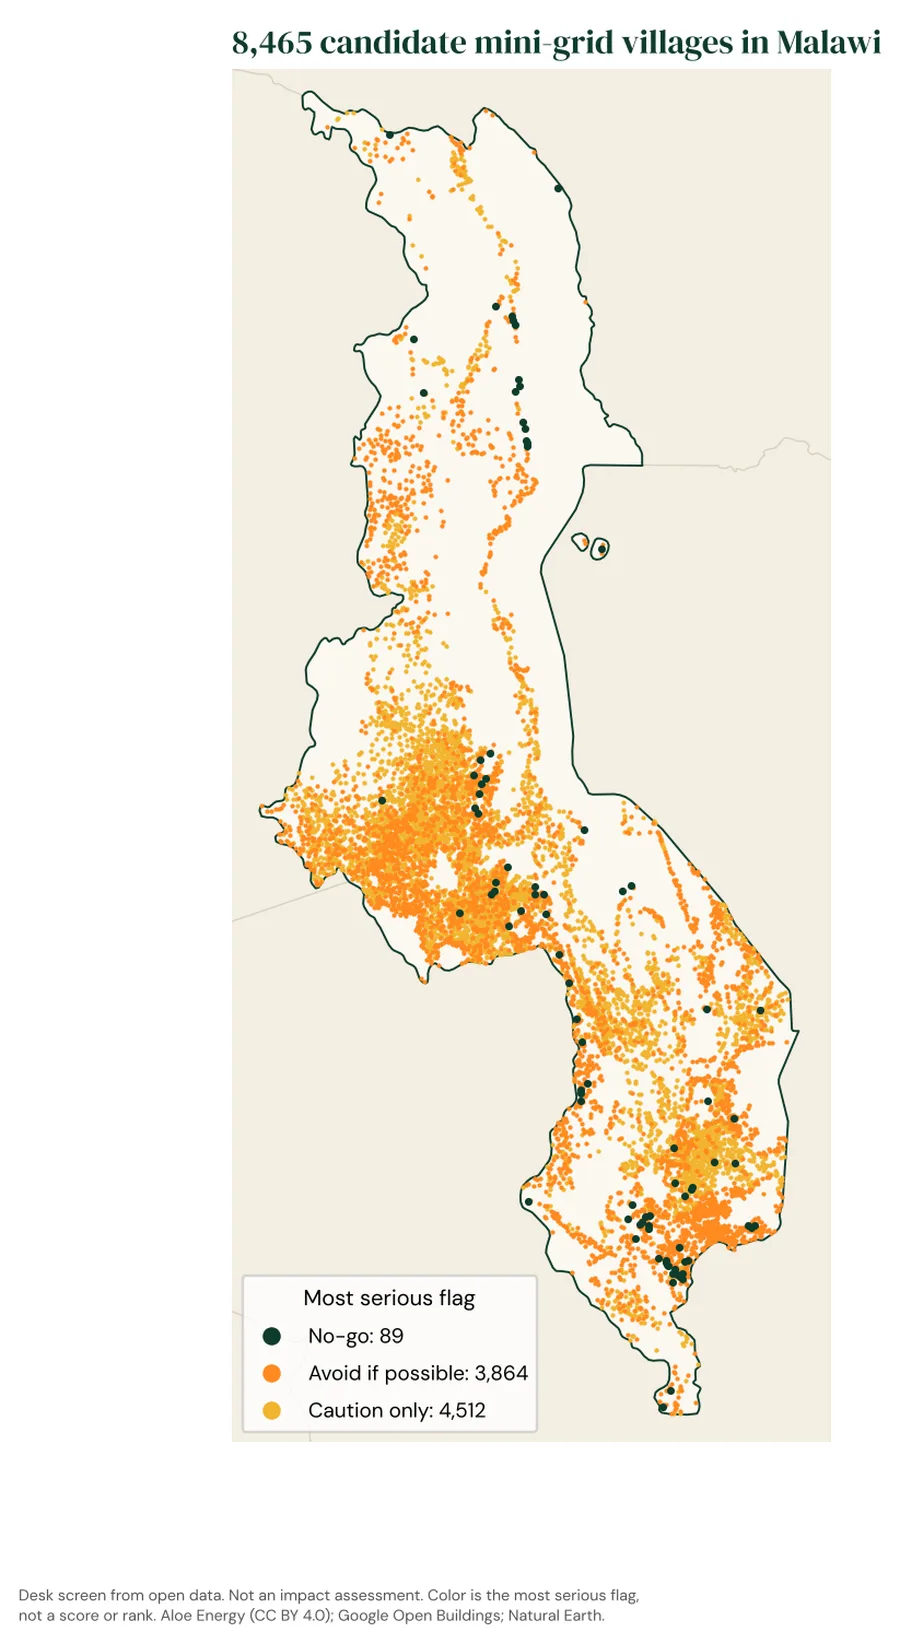
We then ran the screen over the whole country: 8,465 candidate villages of 100 to 2,000 buildings, about 2.8 million buildings in all. Malawi's countryside is so densely settled that villages run into each other, so here a village is a block of 250 m cells with at least 15 buildings each.
- 89 no-go: 86 on ground too steep for the yard, 3 inside a strict protected area.
- 3,864 avoid if possible: most often trees at the yard (2,007), likely critical habitat within 2 km (1,318), an active clearing front nearby (1,176), steep ground (508), a wetland (197) or a mapped grave or place of worship within 500 m (148).
- 4,512 caution only: mostly cropland and bush fire.
- Land and resettlement (PS5 / ESS5) is likely in scope at 7,299 villages, biodiversity (PS6 / ESS6) at 5,387.
For the country run, land cover is read at 40 m and tree loss and surface water at about 60 m instead of 10 m and 30 m, so small yards are read less precisely. Distances to the grid use OpenStreetMap lines, which miss many of Malawi's medium-voltage lines.
Both the Malawi run and the Zambia pilot are a layer in our grid-edge atlas: open the Night lights tab and tick "Constraint screens" to see each village's flags on the map, next to the lines and the night lights.
Mapped to IFC and World Bank standards
Most mini-grid and grid-extension programs in Africa are financed, at some point, by lenders that follow the IFC Performance Standards or the World Bank's Environmental and Social Framework. Every screen ends with a second page that says which standards the flags point to and what the next stage usually needs. It is a pointer for scoping: the lender sets the category (IFC A, B or C; World Bank High, Substantial, Moderate or Low), never this screen.
| Standard | Flags that point to it | What the next stage usually needs |
|---|---|---|
| PS1 / ESS1 Assessment and management | Always in scope | An assessment scaled to risk and a management plan |
| PS2 / ESS2 Labor | Always in scope (contractors, line crews) | Labor management procedures; worker safety under the EHS guidelines |
| PS3 / ESS3 Resource efficiency and pollution | Always in scope | A plan for battery and panel waste, transformer oil and diesel |
| PS4 / ESS4 Community health and safety | Schools and clinics, homes near the line, road crossings, airfields, flooding, bush fire, dams, mines | Clearances and signs, EMF within international limits, fire and flood design |
| PS5 / ESS5 Land and resettlement | Buildings in the footprint, cropland, every line's wayleave | A land and asset survey with a census and cut-off date; a Resettlement Action Plan if anyone must move (whatever the number), a Livelihood Restoration Plan if people lose land or income only (PS5 paras 19 and 25). Easements and rights of way count as land acquisition, and so do restrictions inside utility easements and safety zones (PS5 footnote 2; ESS5 para 4 and footnotes 1-2). |
| PS6 / ESS6 Biodiversity | Protected areas, likely or potential critical habitat, natural habitat, tree cover and loss, wetlands, rivers, bird electrocution and collision risk | Habitat mapping (modified, natural, critical: PS6 paras 11-16, ESS6 paras 19-23); avoid first, offsets last; no net loss of natural habitat (ESS6 para 22), net gains in critical habitat (PS6 paras 17-18, ESS6 para 24); bird-safe poles on lines, about 150 cm horizontal and 100 cm vertical separation as a starting point (IFC/EBRD tip sheet, 2026) |
| PS7 / ESS7 Indigenous Peoples and historically underserved traditional local communities | Always "check": open data cannot show customary tenure or distinct communities | A check against the four ESS7 characteristics (self-identification, collective attachment to land, customary institutions, distinct language; ESS7 para 8); Free, Prior and Informed Consent if customary land, relocation from it or critical cultural heritage is involved (PS7 paras 13-17) |
| PS8 / ESS8 Cultural heritage | Mapped graves, places of worship, heritage sites | A chance find procedure in every works contract; consultation on graves and sacred sites |
| ESS10 Stakeholder engagement | Always in scope | A Stakeholder Engagement Plan disclosed before appraisal and a grievance mechanism that accepts anonymous complaints (ESS10 paras 13, 26-27) |
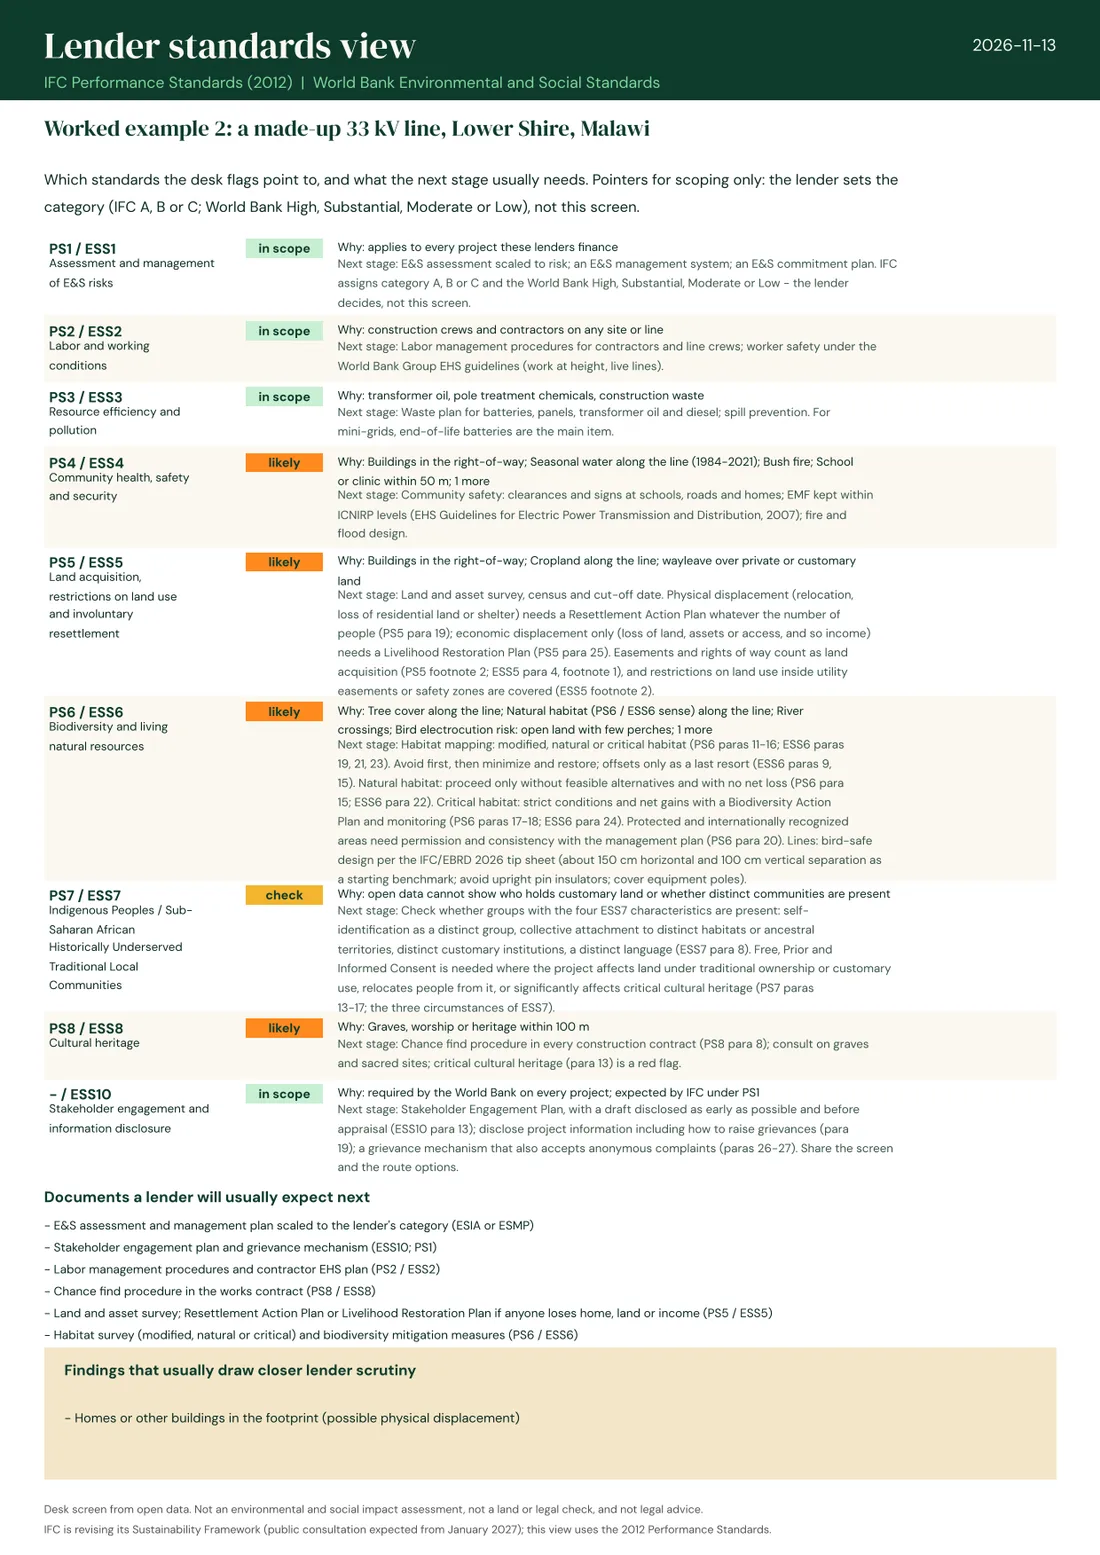
The standards page for the Malawi line. Critical habitat comes from UNEP-WCMC's global Critical Habitat screening layer, built to IFC's own PS6 criteria. IFC is revising its Sustainability Framework, with public consultation expected from January 2027; we will update the mapping when the new standards are published.
Layers and licenses
We only use data whose license lets us publish results and use them in paid work. Some well-known datasets fail that test, so we treat them differently.
| Layer | Source | License |
|---|---|---|
| Protected areas, water, roads, schools, clinics, graves, airfields, power lines | OpenStreetMap contributors | ODbL 1.0 |
| Buildings | Google Open Buildings v3 | CC BY 4.0 |
| Land cover: tree cover, cropland, wetland, built-up | ESA WorldCover 2021 | CC BY 4.0 |
| Tree cover loss 2001-2025 | Hansen / University of Maryland, Global Forest Change v1.13 | CC BY 4.0 |
| Permanent and seasonal water, 1984-2021 | EC JRC / Google, Global Surface Water | Free and open (Copernicus) |
| Population, 2025 estimate | WorldPop R2025A | CC BY 4.0 |
| Slope (120 m) | OpenLandMap, GEDTM30 v1.2 terrain model | CC BY 4.0 |
| Land that floods most years | GIEMS-D15 inundation map (Fluet-Chouinard and others) | CC BY 4.0 |
| How often the land burns, 2001-2020 | GFED5 burned area (Chen and others) | CC BY 4.0 |
| Mine footprints | Tang and Werner, global mining footprint | CC BY 4.0 |
| Likely and potential critical habitat (IFC PS6) | UNEP-WCMC global Critical Habitat screening layer v2.1, basic version | CC BY 4.0 |
| River flood hazard (1-in-100-year) | JRC global river flood hazard maps | Open; being added |
Not used as map layers: the World Database on Protected Areas and Key Biodiversity Areas. Their terms treat fee-based work, even by a not-for-profit, as commercial use and do not allow redistribution. We name them on every sheet and, for a full biodiversity check, recommend an IBAT report. UNESCO World Heritage and Ramsar sites are checked by hand.
What a desk screen cannot see
- Who owns or uses the land. Customary tenure, grazing and seasonal use are out of scope; buildings are counted, not explained.
- Graves, sacred trees and other sites that are not on any map. In rural Africa most are not.
- Villages and paths missing from OpenStreetMap. A blank map does not mean an empty landscape.
- Flash floods and local drainage. The flood layer covers rivers only, and seasonal water stands in where it is missing.
- Whether a community wants the project. That needs people, not pixels.
The output says so on every page: it is a desk screen from open data, not an environmental and social impact assessment, not a land or legal check, and not legal advice.
Want a site or route screened?
We screen single sites, line routes with options, and whole programs of mini-grid sites, and turn the flags into a field checklist. Fees help fund our open research.
Sources and updates
What changed 7 updates
- 16 November 2026 - All of Malawi screened: 8,465 candidate villages, now also in the grid-edge atlas. The Lower Shire pilot is folded into the country run.
- 13 November 2026 - The two pilot areas are now a layer in the grid-edge atlas (Night lights tab).
- 13 November 2026 - Program screening: candidate villages found from building footprints and screened together, with maps for Southern Province, Zambia (77 sites) and the Lower Shire, Malawi (29 sites). Recent tree loss is now flagged as a share of the surrounding land (above 0.5%) rather than a fixed area.
- 12 November 2026 - Paragraph references to the World Bank standards (ESS5, ESS6, ESS7, ESS10) and a bird electrocution check for lines, following the IFC/EBRD 2026 tip sheet.
- 12 November 2026 - Lender standards page added to every screen (IFC Performance Standards and World Bank ESS), with critical habitat from UNEP-WCMC's screening layer and natural versus modified habitat from land cover.
- 12 November 2026 - Slope, land that floods most years, bush fire, mines and quarries, and road and railway crossings added; both examples rerun.
- 11 November 2026 - First edition: method v0.2, two worked examples, layer register.
Common questions
What is an environmental constraint map?
A map, and a list, of the things around a proposed project that could stop it, delay it or make it cost more: protected areas, rivers and wetlands, homes, farmland, forests, heritage sites, airfields. It is built before design starts, so a site or route can be moved while that is still cheap.
Is a desk screening enough for a lender?
No. Lenders that follow the IFC Performance Standards or the World Bank's Environmental and Social Framework ask for an assessment in proportion to the project's risks, which means field work, consultation and, for larger projects, specialists. A desk screen helps decide what that assessment must cover and which sites to drop first. It does not replace it.
Why no score?
A score adds a wetland to a school to a field and gives one number that nobody can act on. A list of flags tells an engineer what to move and a field team what to ask.
Why not use the World Database on Protected Areas?
Its terms forbid commercial use without permission, and they count fee-based work by a non-profit as commercial. We use OpenStreetMap protected areas, which are open, and point to Protected Planet and IBAT for the authoritative check.
Which IFC Performance Standards apply to a mini-grid or a distribution line?
Almost always PS1 (assessment and management), PS2 (labor), PS3 (pollution, mainly battery waste) and PS4 (community safety). PS5 applies whenever land is acquired, including wayleaves and easements for lines. PS6 applies where natural or critical habitat is affected, PS8 where cultural heritage may be, and PS7 where Indigenous Peoples are present. The World Bank's standards follow the same pattern, adding ESS10 on stakeholder engagement for every project.
What is critical habitat under IFC PS6?
Areas of high biodiversity value: habitat for critically endangered or endangered species, for endemic or restricted-range species, for globally significant concentrations of migratory or congregatory species, highly threatened or unique ecosystems, and areas tied to key evolutionary processes. A project in critical habitat must show a net gain in biodiversity. UNEP-WCMC's global screening layer marks where critical habitat is likely or potential; only a field assessment confirms it.
Can I use the method?
Yes. The method and our results are published under CC BY 4.0: reuse them with credit to Aloe Energy. The data layers keep their own licenses, listed above.