
Grows where the grid hasn’t.
Where a new line could go, and what it does to the grid
Draw a transmission line anywhere in the Southern African Power Pool, from a substation or from open ground, and get a least-cost route with a cost range in today's US dollars: towers and terrain, river and line crossings, access tracks, homes and fields in the wayleave, clearing, replanting and the substation works at each end. Then watch the power flows change as you add a power plant or a big load or take a line out, on today's grid or the 2030 and 2035 grids with SAPP's planned lines.
Worked examples from the master plan and a national grid plan
The full model at 1 km, with four route options each: least cost (default), environment first, shortest and following roads and lines. The band shows every route within 5% of the least cost. Under each map: the elevation profile and where along the route the money goes.
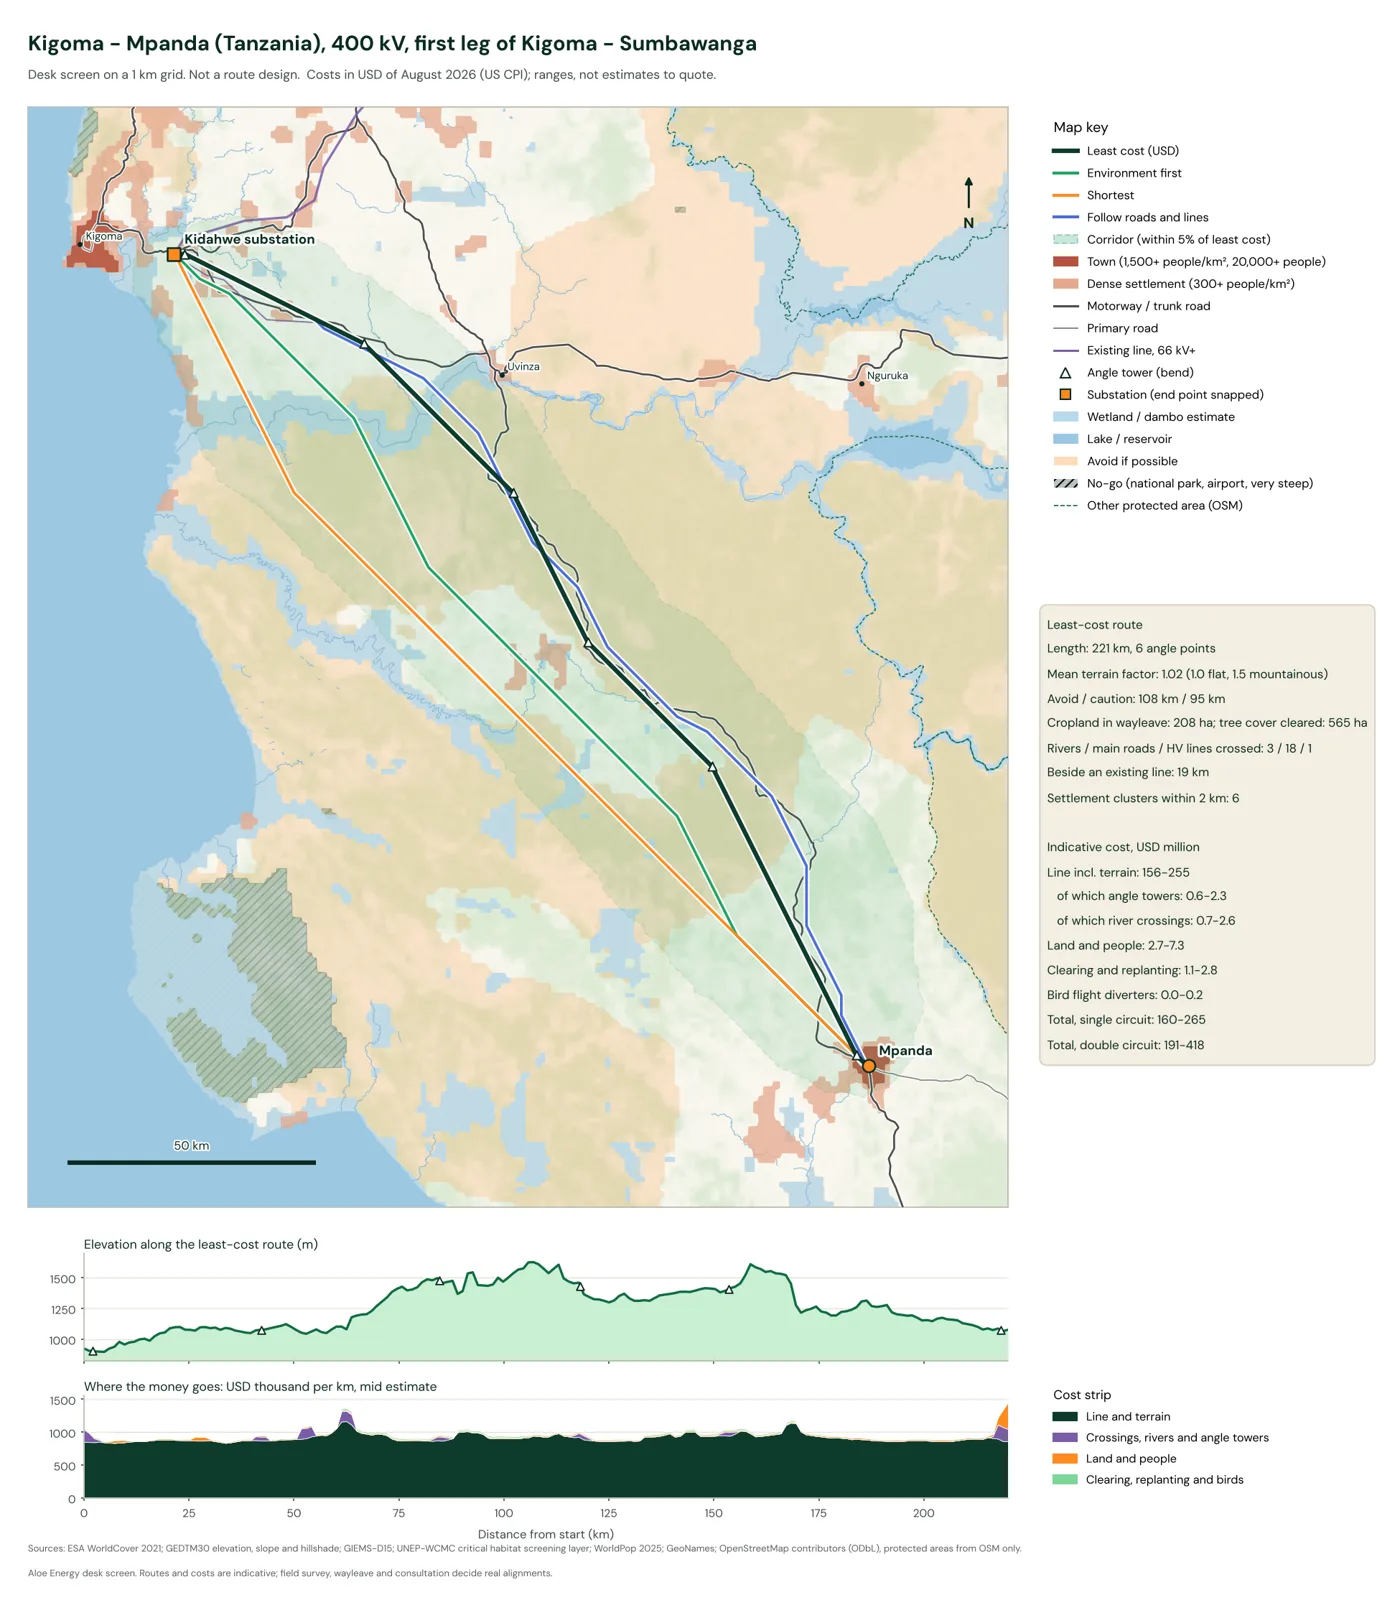
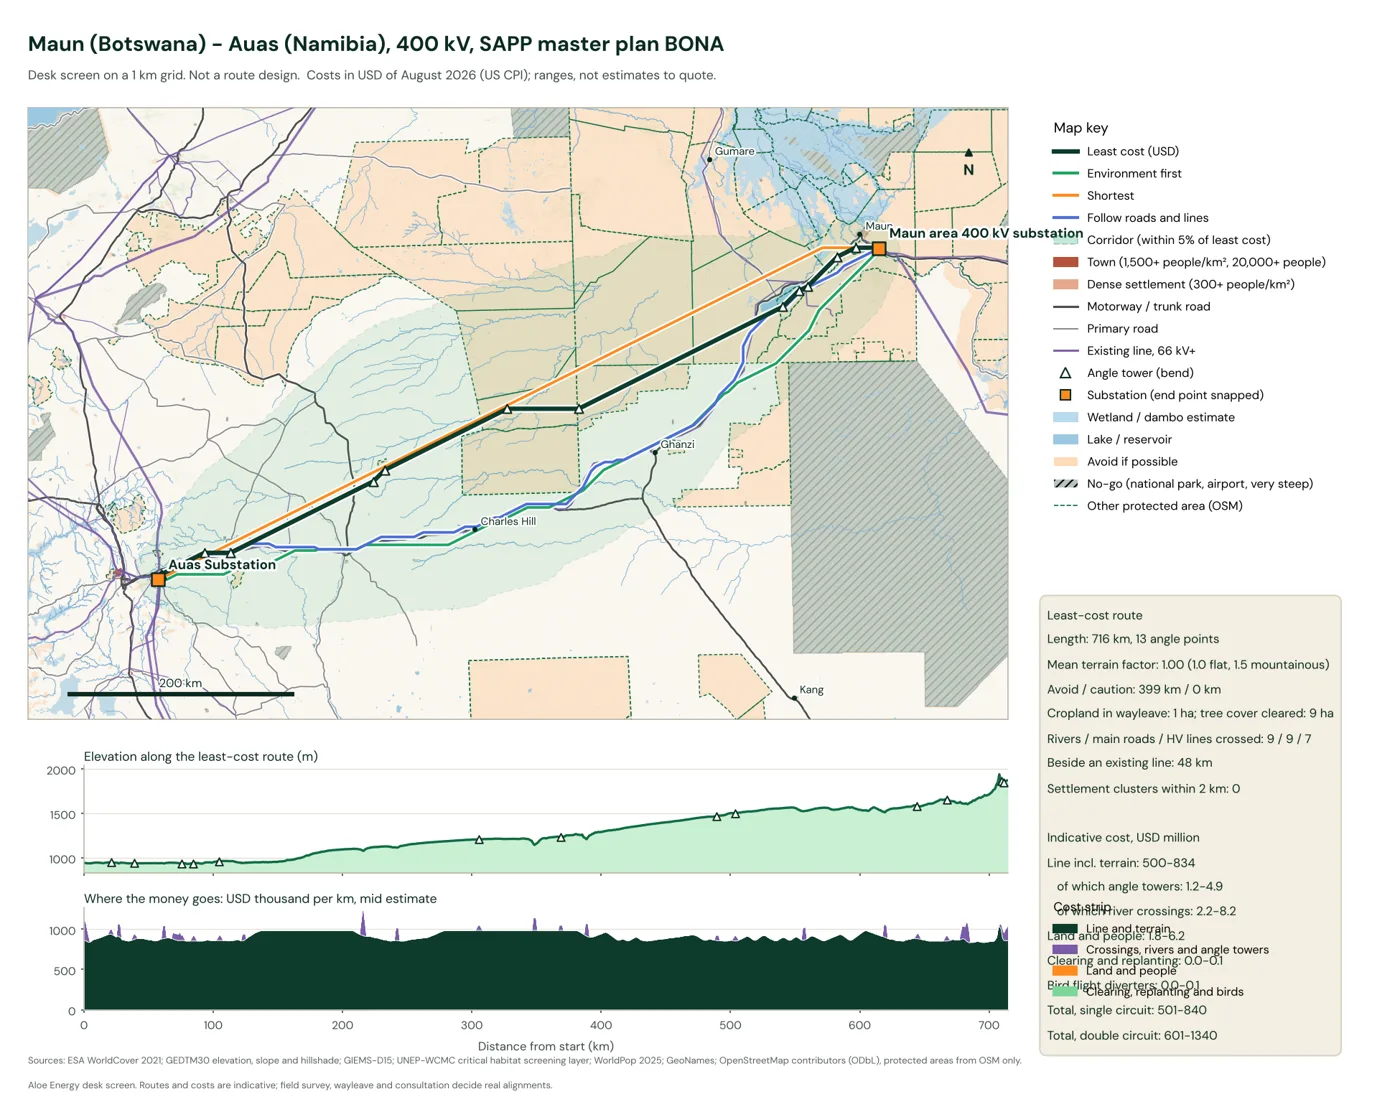
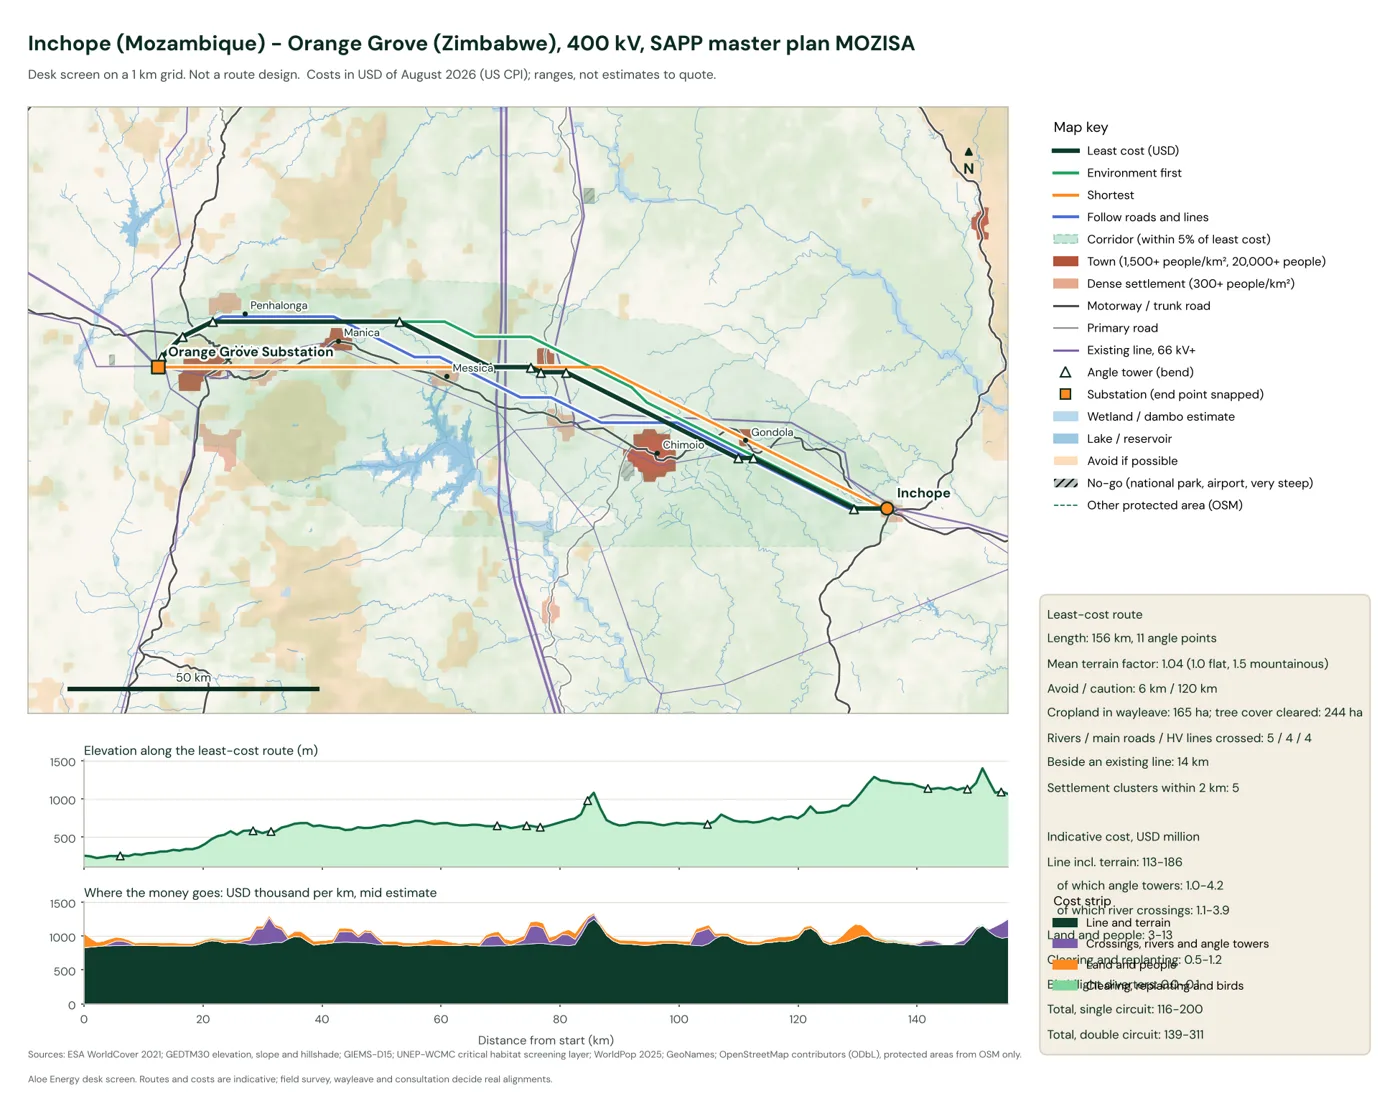
| Route | Length, km | Angle points | Line incl. terrain | Land and people | Environment | Total, USD M |
|---|
All in USD million of August 2026, low to high, single circuit. A double circuit adds about 20 to 60% to the line cost (India's central transmission utility puts a 400 kV double circuit at 1.5 times a single one).
How the cost of a route is built
Every 1 km cell gets a price per kilometer of line, and the router finds the cheapest chain of cells, with an extra charge at every bend. The parts:
- Line and terrain. Whole-project costs from African lines (Isang - Mahikeng, Malawi - Zambia, Uganda - Tanzania, Burundi - Kigoma; USD 400,000 to 850,000 per km in 2021 money), times the World Bank ESMAP terrain factors: 1.0 flat, 1.2 difficult, 1.5 mountainous, from GEDTM30 slope. Wet ground adds 11 to 32% for heavier foundations and wet-season access. Open water needs long spans.
- Bends, rivers and line crossings. An angle tower costs 0.14 to 0.36 km of extra line, built from published cost shares (towers 28 to 42% of line cost, foundations 10 to 15%, about 2.2 towers per km at 400 kV). A river takes a tension tower on each bank; crossing an existing line takes one.
- Access tracks. Away from roads, crews need new tracks: up to 8 to 20% of line cost at 10 km or more from a road. We set the range by checking routes against built lines.
- Following existing lines. Beside an existing line, only part of the wayleave is new land (50 to 75%; Tanzania's Iringa - Mbeya line needed a 70 m combined corridor where a 52 m one would stand alone).
- Land and people. Homes in the wayleave (WorldPop 2025), fields and dambo gardens (ESA WorldCover), wayleave width and compensation rules by country: cash compensation in Zambia and Tanzania (Tanzania also pays for the land), replacement housing and community programs in Mozambique and Malawi, crop schedules in Botswana, market-value servitudes in South Africa.
- Environment. Clearing and replanting tree cover in the wayleave (replanting from the Zambia - Tanzania interconnector's reforestation budget) and bird flight diverters near wetlands and rivers (spacing from Eskom's specification).
Every figure keeps the year of its source and is brought to August 2026 with the US consumer price index. Each country's compensation regime and every engineering unit cost, with its source, is in the data pack.
Checked against lines that were built
We took nine built lines from OpenStreetMap, removed each one from the inputs so the router could not simply follow it, and routed between its real end points. On the median the model lands much closer than a straight line, but line by line it wins in only four of the nine. It does worse where the real line follows a road or an older line corridor across open farmland, as in southern Namibia. The compensation side is checked against five published resettlement budgets; all fall inside the model's range in today's money (an in-sample check, not a forecast).
| Built line | Country | kV | Built, km | Model, km | Share within 5 km, model | Share within 5 km, straight line | Median offset, model, km |
|---|
How the grid carries power in 2026, 2030 and 2035
A power-flow model of the SAPP grid at 220 kV and above, built in pandapower from our grid atlas. It has about 680 substations and 900 lines. Each country's peak demand comes from SAPP's August 2026 report, spread over the grid by population, with mining load placed on the mines in Zambia and DR Congo. Plants come from the atlas. Each country runs its own plants first and buys the rest within its firm import contracts plus the capacity of new interconnectors. Planned lines come in at the target years in SAPP's draft master plan 2025-2045. Demand grows about 3.7% a year, the rate implied by the plan's 2045 peak.
Draw on the grid
Pick a year, then change the grid and watch the flows move. Draw a line: click one substation, then another, or click open ground to start or end at a new substation. The line follows the least-cost route on a 4 km grid and gets a full cost: towers and terrain, access, crossings, angle towers, homes, fields and clearing, and the substation works at both ends, including a new transformer where the substation does not have the line's voltage. Costs are in US dollars of August 2026, ranges for a desk screen. Add a power plant or a load (a mine, a city, a data center) by clicking a substation; to keep supply and demand balanced, the most expensive plants in that grid back off for a new plant, and the cheapest spare plants ramp up for a new load. Take a line out to see what a single outage does. Switch the view to change since start to see which lines your edits load or relieve.
Your grid
Loading the network...
How the browser tool differs from our full model: the full model routes on a 1 km grid and charges every bend an angle tower while it searches; the browser counts bends after the search. Both use the same cost layers. Routes avoid national parks, strict protected areas, airports and very steep ground. Substation works: a line bay at each end (India's central transmission utility, January 2026 prices, as the low end; double for African projects as the high end); a new transformer and bays where the voltage is missing (USD 2.4 to 10 million); a new substation at an open-ground end (USD 4 to 10 million, World Bank ESMAP). Background map © OpenStreetMap contributors.
| Year | Peak demand in the model, MW | Lines over rating | Lines over 80% | Master plan lines in | Demand beyond own plants and firm imports, MW |
|---|
Line ratings follow SAPP's published transfer-limit table: about 300 MW per circuit at 220 kV, 600 MW at 330 kV and 700 MW at 400 kV (1,300 MW for Eskom's heavier 400 kV lines). The last column is demand that neither a country's own plants nor its contracted imports cover in the model; in practice it is met by short-term trades, emergency imports or load shedding.
What each planned line carries in 2030
For each master plan line we ran the 2030 network with and without it. Most new interconnectors carry a few hundred MW at peak. The Nzhelele - Triangle line into Zimbabwe is the exception. As a single circuit it would run at its rating, and it pushes the 330 kV lines beyond Triangle over theirs, so the line only works with reinforcement inside Zimbabwe.
| Line | Target year | kV | km | Flow at peak, MW | Loading | Largest relief elsewhere, MW |
|---|
Flows from a DC power flow at the evening peak, when solar is off. Contracted trades on top of physical flows are not modeled. Line names as in SAPP's draft master plan.
One line out
Grid planners design for the loss of any single line, the "N-1" rule. We took out each 330 kV or larger line in turn and counted lines pushed at least 10 points over their rating that were not overloaded before. Most of these outages cluster in a few places: South Africa's coal belt, where flows are large, and the long single-circuit 330 kV chains in Zambia and Zimbabwe.
Limits
- This is a desk screen on public data. Field survey, wayleave negotiation and consultation decide real alignments; utility studies decide real line loadings.
- The network model is simplified: no lines below 220 kV (except Malawi's 132 kV backbone), typical electrical values by voltage, gaps in OpenStreetMap bridged within 30 km, and a lossless DC power flow. Absolute loadings are indicative; changes between cases are more reliable than single numbers.
- Two built lines missing from OpenStreetMap were added from TANESCO announcements (Julius Nyerere - Chalinze and Chalinze - Dodoma, 400 kV). HVDC links run at fixed transfers.
- Planned lines enter at SAPP's target years. Many will slip; our grid atlas tracks how far.
- Costs are ranges. Land and compensation values in Botswana, South Africa, Zimbabwe and Namibia partly rest on our assumptions where no published rates exist.
Sources and updates
What changed
- 17 November 2026: first version. One interactive map: draw a line on the grid and get its least-cost route, full cost with substation works and the change in power flows. Three worked routes, a nine-line check and a network model for 2026, 2030 and 2035.
Quote or embed it
Free to quote and embed with credit (see our data and terms). To embed the page:
Cite it
APA, with the date you viewed it:
Common questions
Is this a route design?
No. It is a first look at where a corridor could run and what it might cost, on a 1 km grid (4 km in the browser tool). A real route comes from survey, environmental and social assessment and talks with the people who live along it.
Why does the route bend where it does?
On flat ground the line itself is about nine tenths of the cost, so the route stays close to straight and bends only where something costs more than a bend: a river, a wetland or dambo, a town, steep ground, an existing line, or a long stretch away from any road.
Why are the costs ranges?
Unit costs vary a lot between projects and countries, and our sources span 2015 to 2026. We bring them all to August 2026 dollars with the US consumer price index and show the low and high ends rather than a single number.
Is the network model a utility load-flow study?
No. It uses public data, typical electrical values and a simplified market. It shows where the grid is tight and how planned lines shift the flows, at the level of detail a desk screen allows.
Can I get the data?
The cost tables with sources, route results and network outputs are available by email at [email protected].