
Grows where the grid hasn’t.
Carbon, certificates and the bottom line
Carbon credits and renewable energy certificates are often presented as the money that makes clean power projects work. We built open financial models of grid solar, rooftop solar and a mini-grid to see how much they really change the tariff a project needs, its returns and the case for its lenders.
How much each stream lowers the tariff a project needs
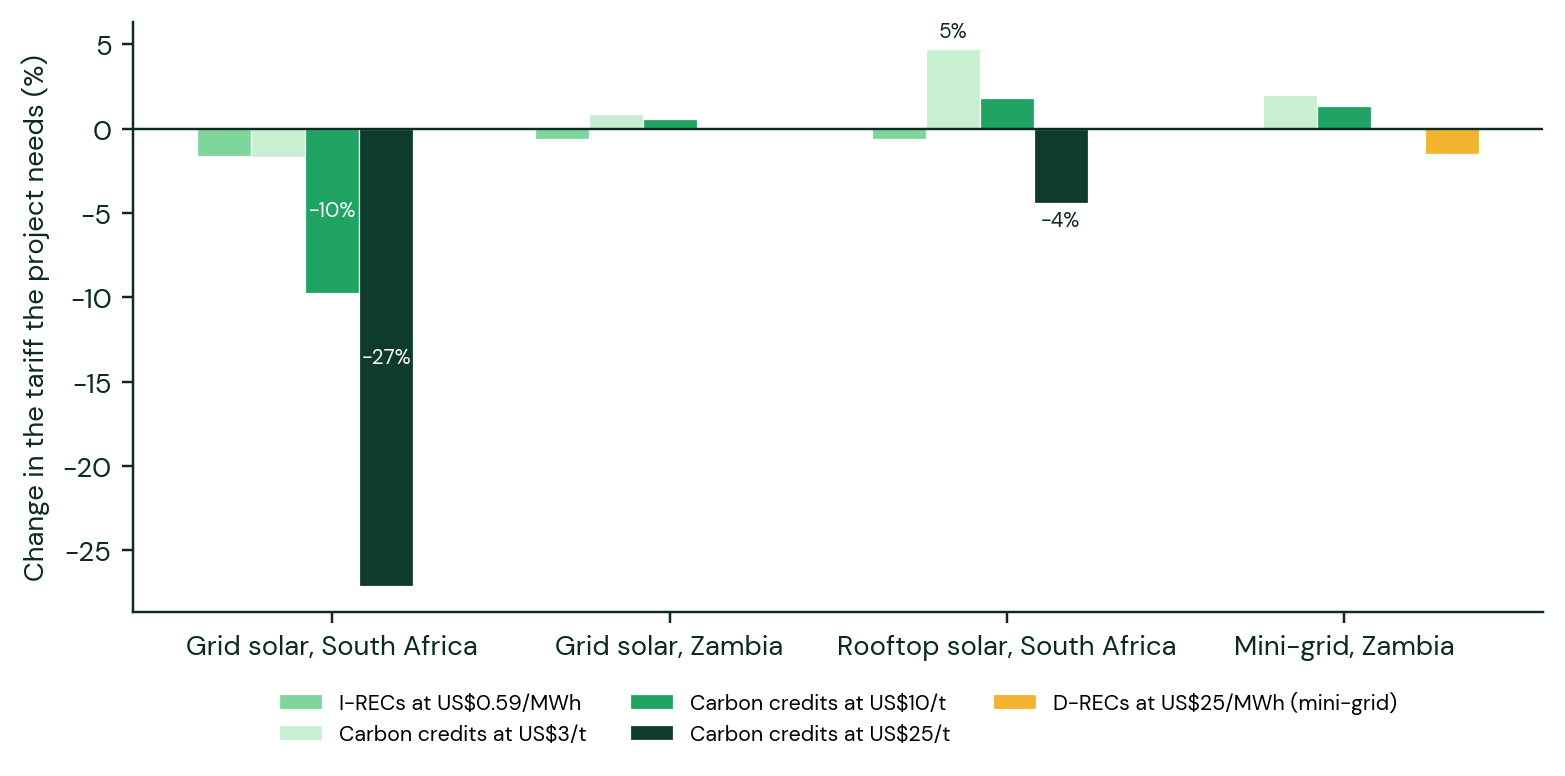
- South Africa: carbon credits at US$10 per tonne lower the tariff 50 MW of grid solar needs by about 10%, and by 27% at US$25, if the project is additional. With the UN's cautious default factor instead, only about 1%.
- Zambia: credits barely cover their certification costs below about US$17 per tonne.
- I-RECs: under 2% off the tariff at US$0.59/MWh. Their value is mostly to buyers.
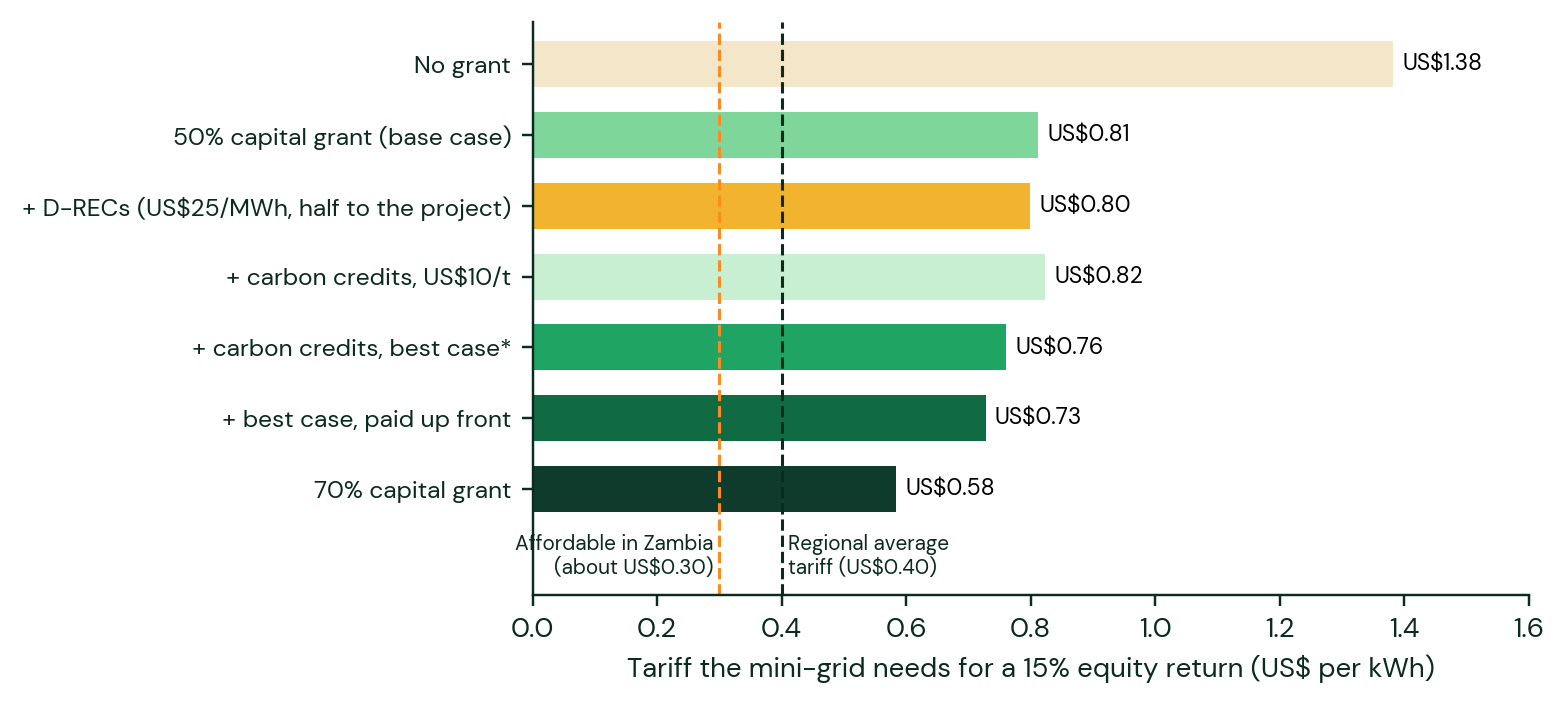
- Mini-grids: our 100 kWp model needs about US$0.81/kWh even with a 50% grant, against about US$0.30 that households can afford. A 70% grant does more than any carbon or certificate deal.
- Rooftop solar: already profitable; certificates help the business buying the power claim clean electricity.
- Lenders: rarely count carbon. Fixed-price offtake, prepayment and results-based schemes are what make it bankable.
Grid mix and carbon credits per MWh of solar
A megawatt-hour of new solar earns carbon credits for the fossil power it replaces. Coal-heavy grids give a lot, hydro grids almost nothing. Each of 36 countries across Southern, Eastern, West and Central Africa is shown with its mix next to the credits under the UN's new electricity tool, from our grid emission factors.
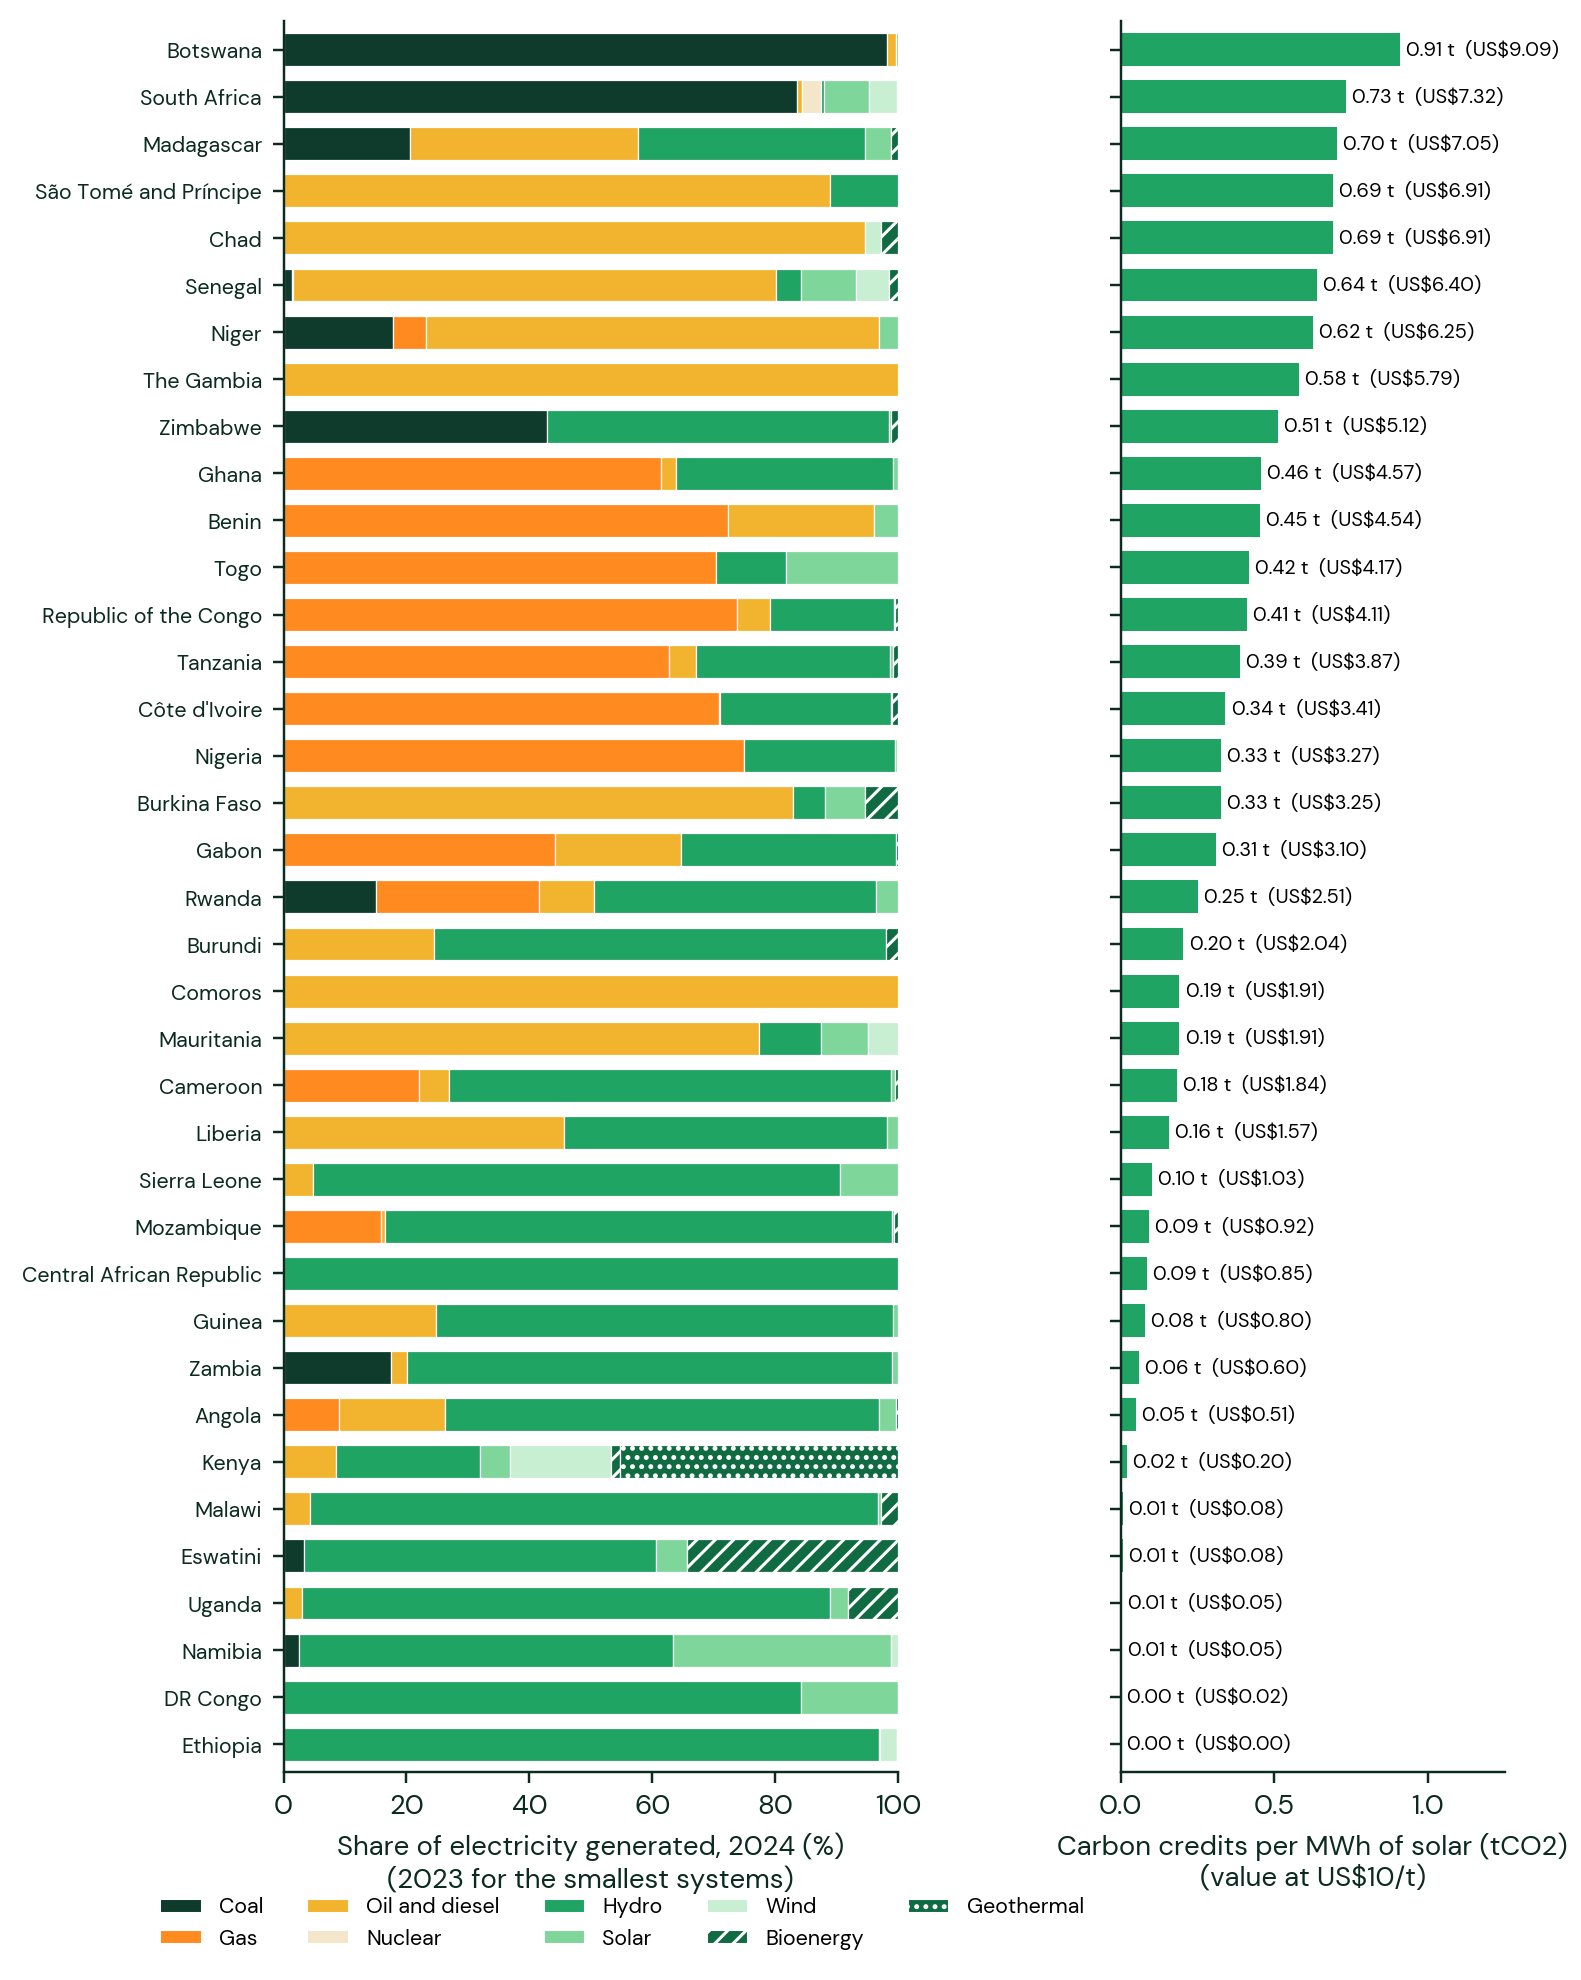
Generation mix 2024 (2023 for the smallest systems): Ember (US EIA data) with Energy Regulation Board figures for Zambia. Lesotho and the Comoros are not shown. Carbon credits: combined margin for wind and solar, A6.4-AMT-007 weights.
Test a project
Pick a project, the grid it replaces and your own prices. The model finds the flat tariff at which investors earn their target return, with and without each extra revenue stream. A megawatt-hour can only be sold once, so the rows are alternatives.
| Revenue stream | Tariff needed | Change | Equity return at base tariff |
|---|
Real US dollars, before tax. Grid and rooftop projects use the grid's carbon credits per MWh (new UN tool, wind and solar); the mini-grid uses 1.73 tCO2/MWh for the diesel and kerosene it replaces. Carbon credits start in year 3, last 10 years and carry set-up and verification costs, levies and a broker's share. Other inputs are in the report's annex. Indicative only, not financial advice.
Small volumes, big gap
One carbon credit, many hands
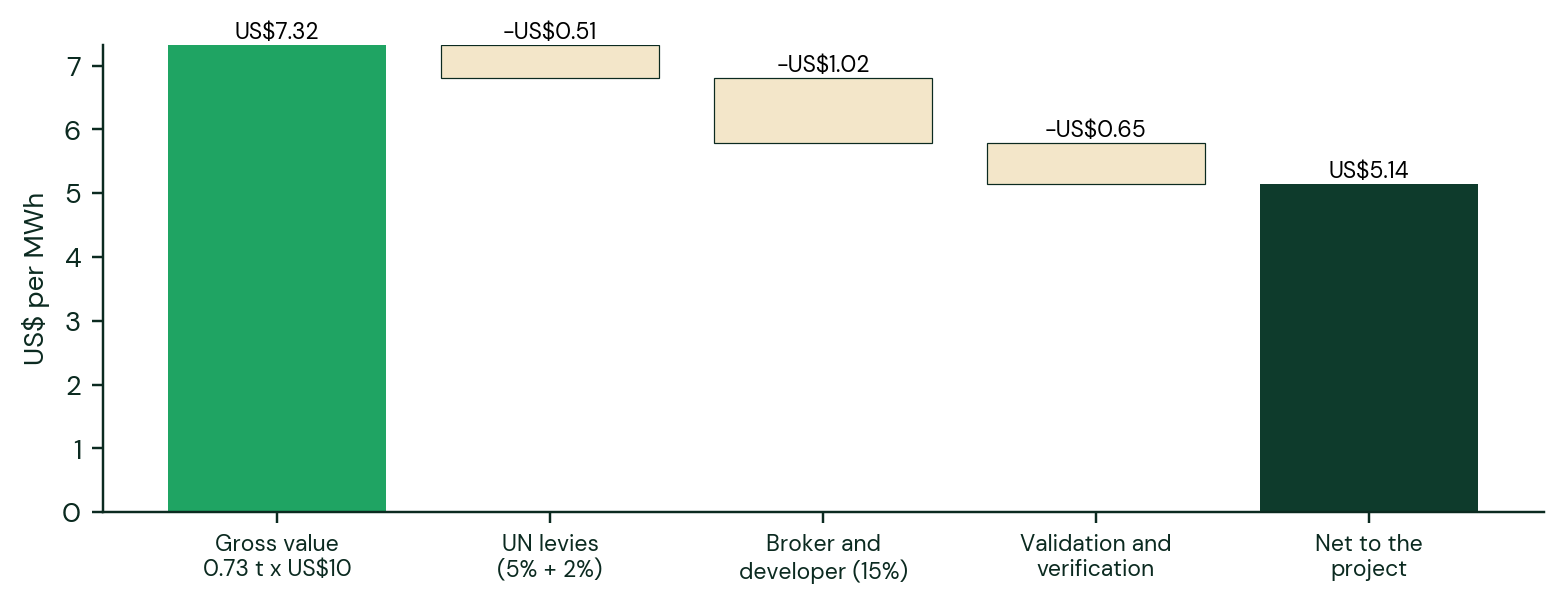
Of US$7.32 of carbon value per megawatt-hour of South African solar at US$10 per tonne, about US$5.14 reaches the project after UN levies, the broker's share and verification costs.
Method, sources and updates
Read the report
The full report has the method, every assumption with its source, the results tables and recommendations for developers, funders and governments.
Version 1.0, November 2026, CC BY 4.0. The model is available on request: email [email protected]. See also our certificates page and Article 6 tracker.
How we made this
Four illustrative projects, each with an annual cash-flow model in real US dollars before tax: grid solar in South Africa (set so its tariff lands near the latest REIPPPP solar prices) and Zambia (commercial terms), rooftop solar in South Africa and a solar mini-grid in Zambia. Inputs come from public sources such as IRENA, AMDA, REIPPPP results, the I-REC fee schedule, Ecosystem Marketplace and the World Bank, or are marked as assumptions.
What changed
- November 2026 - First edition: report and interactive model.
Common questions
Do carbon credits make solar projects bankable in Southern Africa?
Where the grid burns coal, as in South Africa, they can lower the tariff a solar plant needs by about 10% at US$10 per tonne, if the project is additional. In hydro countries such as Zambia they barely cover their own costs for grid-connected solar. Lenders rarely count carbon unless it comes with a fixed-price buyer or a prepayment.
Are renewable energy certificates worth it for a project developer?
They are cheap to register and simple to sell, but at about US$0.59/MWh in South Africa they lower the tariff a project needs by less than 2%. Their main value is to buyers who need them to claim clean power.
Can carbon credits fund mini-grids?
They help at the margin. Mini-grids sell little energy, so certification costs eat most of the value unless many sites share them. They work best when a buyer pays up front. Capital grants and results-based finance still decide whether a mini-grid can charge an affordable tariff.
Which grid emission factor should a project use?
Calculating the combined margin with good grid data usually gives far more credits than the UN tool's cautious default. See our grid emission factors for 38 African countries.