
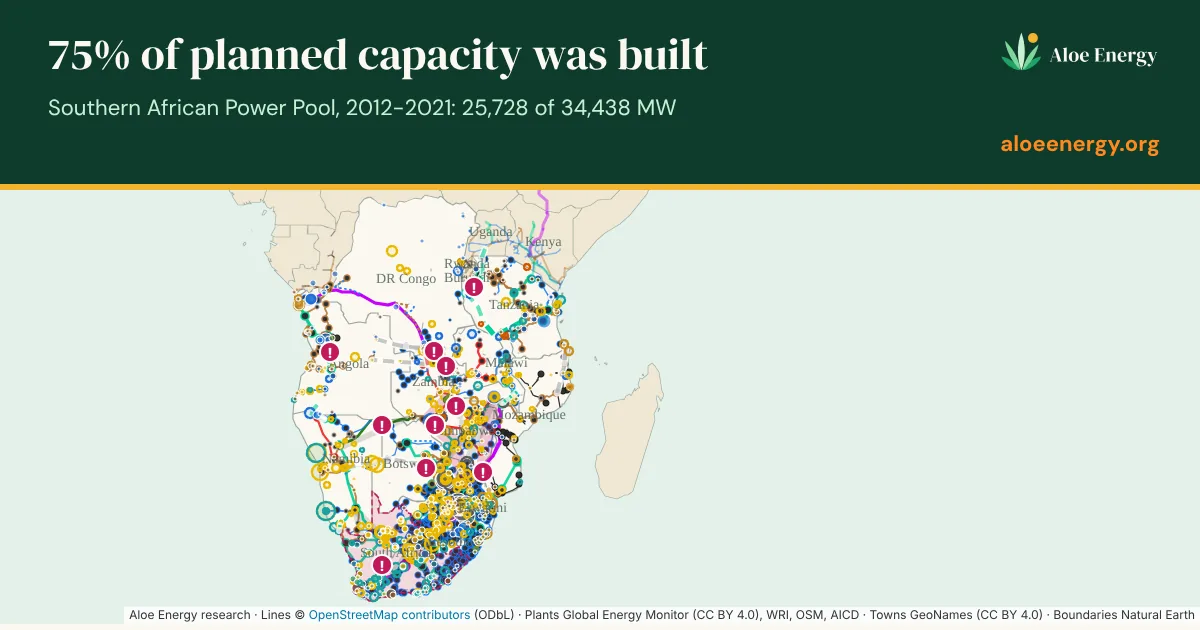
So we built one map that does. The SAPP grid atlas is a free, interactive map of the Southern African Power Pool: the grid as it stands today, every power plant of 10 MW and above, the projects in the pipeline, and the regional master plan to 2045. It covers all 12 member countries, from the DR Congo and Tanzania to the Cape.
Why we built it
We work at the grid edge, where mini-grids, solar and the national grid meet. To plan well there, you need to know where the grid is, where it is going, and how reliable those plans are. A mini-grid 5 km from a line that will arrive next year is a very different investment from one 50 km away from a line that keeps slipping.
That information exists, but it is scattered across utility reports, funder documents, OpenStreetMap and news. We wanted to bring it together in one place, keep the source for every line and plant, and make it free to look at.
What you can do with it
- Slide through time. Move the timeline from 2004 to 2045 to watch the region build its grid, then see what is promised next.
- Filter by voltage. Show lines from 66 kV up to 765 kV. Substations are sized by voltage and list the lines that end there.
- Search. Find 2,527 towns, power plants, substations and pipeline projects. A town shows its population and the straight-line distance to the nearest mapped line.
- Share a view. Every view has its own link, so you can send a colleague exactly the line or plant you mean.
Three things the map shows
Promises and delivery are two different things. For every planned line and plant, the atlas keeps each date that was promised, who promised it and where. Of the capacity planned for 2012 to 2021, 75% was actually built: 25,728 of 34,438 MW. Some projects slip. Mphanda Nkuwa in Mozambique has moved six years, from 2028 in the 2017 regional plan to 2034 today. Others surprise. Tanzania's Julius Nyerere hydro arrived 13 years ahead of the 2017 plan, which still penciled it in for 2039.
The grid is not one grid yet. Angola and Tanzania are still not connected to the regional network. Power cannot flow freely between all 12 members, whatever the map of the region suggests.
The bottlenecks are mappable. The atlas shows SAPP's own limits on 29 interconnections: how much of each line's rating can actually be used. It also flags places where the grid itself is the constraint: no spare capacity in parts of the Cape, about 1,000 MW between Mozambique and South Africa, single links that a whole country depends on, and drought risk on the Zambezi. For mini-grids and local generation, these are the places where power close to demand is worth the most.
Built from public data, kept up to date
Everything on the map comes from public sources: OpenStreetMap for the grid, gap-filled from TANESCO (2015) and World Bank (2017) maps; Global Energy Monitor's Global Integrated Power Tracker for plants; SAPP annual and monthly reports and the draft 2025-2045 master plan for plans and limits; plus NTCSA and IRENA.
Every month we check those sources again and update the map. Each change is listed with its source in a "What changed" log on the atlas page. The first update has already added Global Energy Monitor's latest plant data, bringing the map to 434 operating plants and 465 in the pipeline. When SAPP publishes its final master plan, expected in December 2026, it will replace the draft.
What it is not
Routes are indicative. This is a screening and learning tool, not a basis for engineering or investment decisions. If you need that level of detail, that is the kind of study we do.
Take a look
The map is free to view. If you want the underlying data, spot an error, or know of a source we have missed, email [email protected]. Corrections make the map better for everyone.
← All posts · Next: Where Southern Africa's solar panels and batteries will retire