
Grows where the grid hasn’t.
The CAPP grid atlas
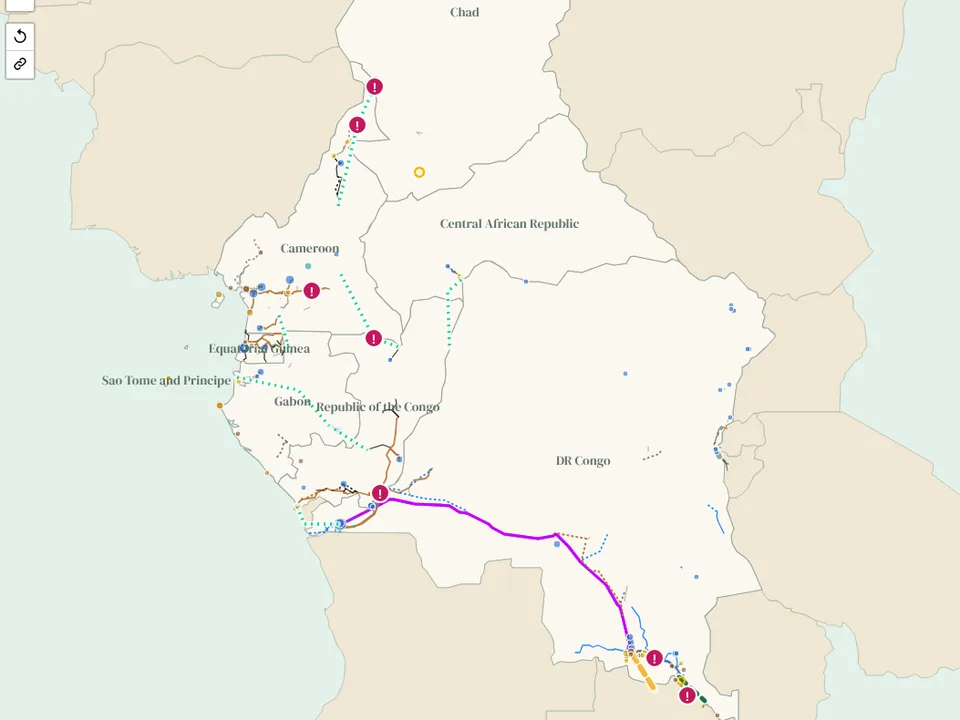
One map of Central Africa's power system in 8 countries, from Chad to the DR Congo: the grid today, every power plant of 1 MW and above, the regional lines being built and the projects CAPP wants next.
Print the map
Two A0 posters of the CAPP grid, free to download: the grid and power plants today, and everything planned to 2035 and beyond. There is also an A2 pair for each member country.
Free to print and share for non-commercial use with credit to Aloe Energy, unchanged (CC BY-NC-ND 4.0). A0 (841 x 1189 mm); prints well at A1 too.
Sources and updates
Sources
Grid lines, substations and some plants from OpenStreetMap (extracted 19 November 2026), with gaps filled from the World Bank (2017) map. Plants from Global Energy Monitor's Global Integrated Power Tracker (September 2026, CC BY 4.0), then the WRI database, OpenStreetMap and the World Bank AICD list where GEM has nothing. Projects and interconnectors from CAPP and CEEAC, the World Bank, the African Development Bank, the EU, PIDA and the Africa Energy Portal compact brief (2026). CAPP has no published master plan with dates, so the plan layer shows the CEEAC/CAPP priority projects as presented in March 2017, with their status from 2026 sources. Access from the World Bank (2024).
Open grid data is uneven: the DR Congo, Cameroon, Congo and Equatorial Guinea have their main lines mapped, while Chad, the Central African Republic and Sao Tome and Principe have few mapped lines. We publish what the open data shows and add to it every month.
The data
The map is free to view. For the underlying data, email [email protected].
Routes for projects and master plan lines are indicative, and the map is not for engineering or investment decisions. Email [email protected] to send a correction.
Sources behind each feature
Every line, substation, plant and project on the map lists the public sources that show it. Click a feature to see them, or set "Color lines by" to "Number of sources". Of 17,012 km of line in the CAPP grid atlas, 50% is confirmed by two or more sources (20 km by three or more) and 50% rests on one. Of 158 power plants, 29 appear in two or more sources. Counts as of 13 November 2026.
OpenStreetMap lines also shown in:
- World Bank Africa grid map (2017): 8,574 km
The rules are the same for all our grid atlases: what counts as a source.
What changed 2 updates
Every month we check CAPP, utilities, funders and project news for new lines, plants and dates, and update the map. Each change keeps its source.
- 19 November 2026 - Free posters: two A0 sheets of the CAPP grid, today and to 2035 and beyond, and an A2 pair per country. Download them from this page or from Posters.
- 19 November 2026 - First edition published: 8 countries (the DR Congo is also in the SAPP atlas), the grid from OpenStreetMap (66 kV and above, plus lines with no voltage tag) with gaps filled from the World Bank 2017 map, 158 power plants of 10 MW and above and 26 more from 1 MW, 11 regional transmission projects with their date history, 4 interconnectors, the CAPP priority projects and seven constraints. Same tools as our other grid atlases.
Get these changes by email
Once a month we send one short email with what changed across all our atlases and pages, each change with its source, plus new research and open data.
Common questions
Where can I find a map of the Central African Power Pool grid?
Right here. The CAPP grid atlas is a free interactive map of the grid in 8 Central African countries: transmission lines, substations, power plants of 1 MW and above, interconnectors, the regional project pipeline and the CAPP priority projects. Open it full screen.
Which countries are on the map?
Cameroon, the Central African Republic, Chad, the DR Congo, the Republic of the Congo, Equatorial Guinea, Gabon and Sao Tome and Principe. The DR Congo belongs to both CAPP and SAPP, so it is in both atlases.
Which regional projects are tracked?
11 lines, including the Cameroon - Chad interconnection (PIRECT) and Cameroon's north - south link, Gabon - Congo 400 kV, Pointe-Noire - Cabinda, Cameroon - Gabon - Equatorial Guinea, the Chollet hydro lines and, in the DR Congo, Inga - Soyo, the Angola - DRC line and the Kalumbila - Kolwezi interconnector.
How much power do Central African countries trade?
Very little. Apart from the Congo - DR Congo line, which is used largely for reactive power support, there is essentially no operating cross-border trade between CAPP members. The DR Congo also trades with Zambia and over the Ruzizi corridor with Rwanda and Burundi.
Can I download the data?
The map is free to view. The underlying data is available on request: email [email protected].
How often is it updated?
Every month, with each change and its source listed in the changelog on this page.
 Spotted an error, or something missing on this page? Report an issue or send feedback