
Grows where the grid hasn’t.
The WAPP grid atlas
One map of West Africa's power system in 16 countries, from Mauritania and Senegal to Nigeria and Niger: the grid today, every power plant of 1 MW and above, the regional lines being built and what the 2019-2033 master plan wants next.
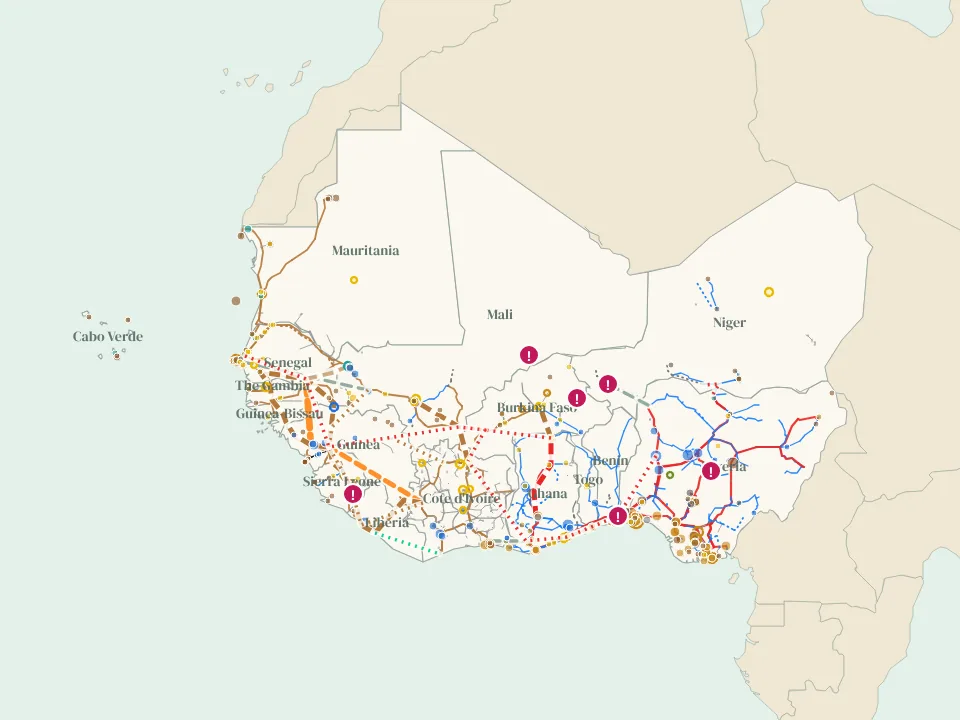
Print the map
Two A0 posters of the WAPP grid, free to download: the grid and power plants today, and everything planned to 2035 and beyond. There is also an A2 pair for each member country.
Free to print and share for non-commercial use with credit to Aloe Energy, unchanged (CC BY-NC-ND 4.0). A0 (841 x 1189 mm); prints well at A1 too.
Promises, and what got built
For every regional line in the pipeline, the atlas keeps each date that was promised, who promised it and where.
- The North Core 330 kV line from Nigeria to Niger, Benin and Burkina Faso was promised for 2023, then 2024 and 2026. In November 2026 it was over 75% built.
- The OMVG loop joining Guinea, Guinea-Bissau, The Gambia and Senegal was planned for 2017. The line was finished in November 2023, and its last sections are being commissioned in phases to 2028.
- The CLSG line from Cote d'Ivoire to Liberia, Sierra Leone and Guinea was planned for 2014 and began commercial operation in December 2021.
Wires are not the only limit
Nigeria has more than 13,000 MW installed, yet peak delivery has never passed about 5,800 MW, and its grid still collapses several times a year. Its neighbors buy about 360 MW of it and pay late. Insecurity in the Sahel slows the new lines, and Mali, Burkina Faso and Niger have left ECOWAS while still trading power.
Where the grid is weak or slow to arrive, solar and storage close to demand can carry the load sooner.
Sources and updates
Sources
Grid lines, substations and some plants from OpenStreetMap (extracted 17-18 November 2026), with gaps filled from the World Bank (2017) map, which uses ECREEE data for West Africa. Plants from Global Energy Monitor's Global Integrated Power Tracker (September 2026, CC BY 4.0), then the WRI database, OpenStreetMap and the World Bank AICD list where GEM has nothing. Projects and interconnectors from WAPP, the World Bank, the African Development Bank, the EIB, CI-Energies, TCN and NERC. The master plan is the ECOWAS master plan for regional power generation and transmission 2019-2033. Access figures from the World Bank (2024). Line colors match our SAPP atlas.
Open grid data is uneven: Nigeria, Ghana and Cote d'Ivoire are mapped in detail, while Liberia, Sierra Leone, Guinea-Bissau and Cabo Verde have few mapped lines. Peak demand is published for few countries.
The data
The map is free to view. For the underlying data, email [email protected].
Routes for projects and master plan lines are indicative, and the map is not for engineering or investment decisions. Email [email protected] to send a correction.
Sources behind each feature
Every line, substation, plant and project on the map lists the public sources that show it. Click a feature to see them, or set "Color lines by" to "Number of sources". Of 49,962 km of line in the WAPP grid atlas, 65% is confirmed by two or more sources (0 km by three or more) and 35% rests on one. Of 488 power plants, 78 appear in two or more sources. Counts as of 13 November 2026.
OpenStreetMap lines also shown in:
- World Bank Africa grid map (2017): 32,453 km
The rules are the same for all our grid atlases: what counts as a source.
What changed 2 updates
Every month we check WAPP, utilities, funders and project news for new lines, plants and dates, and update the map. Each change keeps its source.
- 19 November 2026 - Free posters: two A0 sheets of the WAPP grid, today and to 2035 and beyond, and an A2 pair per country. Download them from this page or from Posters.
- 19 November 2026 - First edition published: 16 countries, the grid from OpenStreetMap (66 kV and above, plus lines with no voltage tag) with gaps filled from the World Bank 2017 map, 488 power plants of 10 MW and above and 53 more from 1 MW, 15 regional transmission projects with their date history, 11 interconnectors, the 2019-2033 master plan and six constraints. Same tools as the SAPP, EAPP and Madagascar atlases.
Get these changes by email
Once a month we send one short email with what changed across all our atlases and pages, each change with its source, plus new research and open data.
Common questions
Where can I find a map of the West African Power Pool grid?
Right here. The WAPP grid atlas is a free interactive map of the grid in 16 West African countries: transmission lines, substations, power plants of 1 MW and above, interconnectors, the regional project pipeline and the 2019-2033 master plan. Open it full screen.
Which countries are on the map?
Benin, Burkina Faso, Cabo Verde, Cote d'Ivoire, The Gambia, Ghana, Guinea, Guinea-Bissau, Liberia, Mali, Mauritania, Niger, Nigeria, Senegal, Sierra Leone and Togo. Mauritania is not a WAPP member but shares the OMVS grid with Mali and Senegal; Cabo Verde has its own island grids.
Which regional projects are tracked?
15 lines, including CLSG, the OMVG loop, the North Core 330 kV line, the Ghana-Cote d'Ivoire 330 kV reinforcement, the Guinea-Mali and Mauritania-Mali 225 kV interconnections, Linsan-Fomi and the Ghana-Burkina Faso-Mali 330 kV line.
How much power do West African countries trade?
About 8% of the region's electricity crosses a border, according to the World Bank. Nigeria exports about 360 MW to Benin, Togo and Niger, Guinea about 1,174 GWh a year over the OMVG loop, and Cote d'Ivoire sells to its six neighbors. The interconnectors panel shows rated and traded power where they are published.
Can I download the data?
The map is free to view. The underlying data is available on request: email [email protected].
How often is it updated?
Every month, with each change and its source listed in the changelog on this page.
 Spotted an error, or something missing on this page? Report an issue or send feedback