
Eastern Africa Power Pool
Somalia electricity grid and access
About 8.2 million people in Somalia live where satellites see no electric light at night, and 7% of them live within 15 km of a power line. This page brings together what our open atlases show for Somalia: about 6 km of high-voltage lines, 125 MW of power plants and the projects still to come.
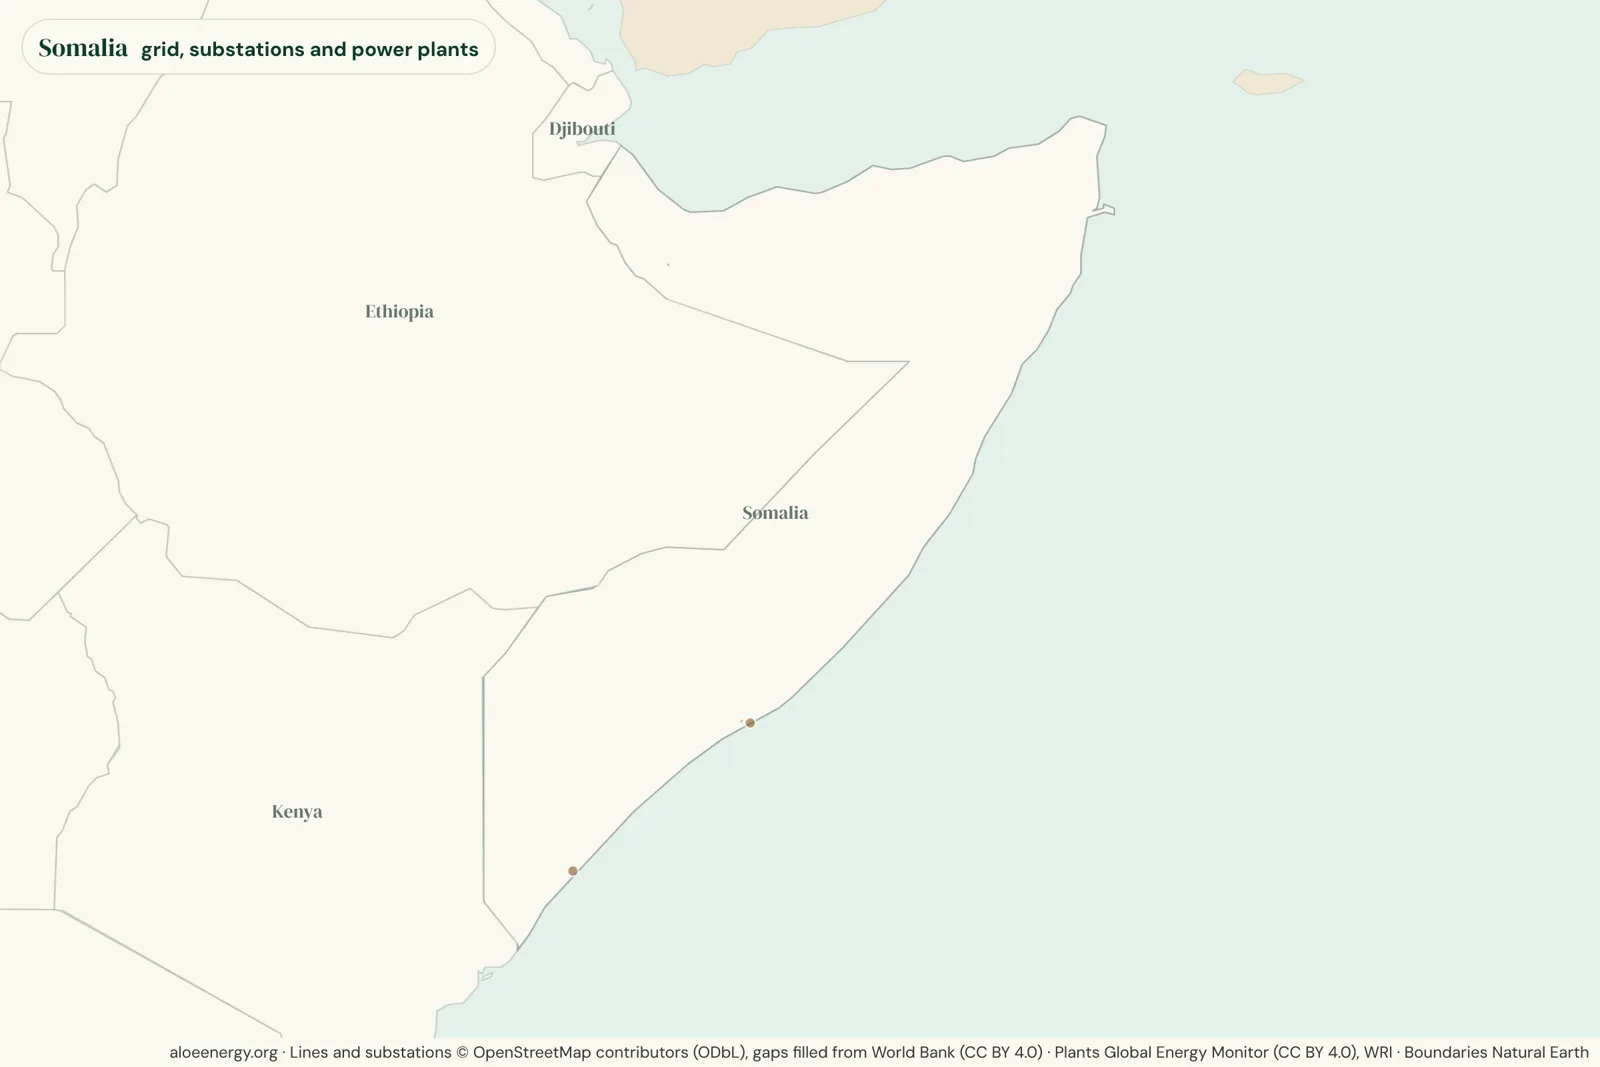
Lines, substations and demand
Somalia's mapped high-voltage network runs to about 6 km of lines at 66 kV and above. Installed capacity was about 110 MW (2024). The latest international tracking report puts access to electricity at 54% of people.
| Voltage | km |
|---|---|
| Voltage not recorded | 6 |
| Total | 6 |
Who lives near the grid but off it
About 8.2 million people in Somalia, roughly 43% of the population, live where satellites see no electric light at night. Of them, 7% live within 15 km of a mapped or predicted power line: 154,000 within 2 km, 425,000 2 to 15 km away, and 7.7 million farther out. The largest group lives more than 15 km from any line, where standalone solar and mini-grids are the realistic first step for years to come.
- Within 2 km: 154,000 (2%)
- 2 to 15 km: 425,000 (5%)
- More than 15 km: 7.7 million (93%)
See the numbers as a table
| Distance | Million people | Share |
|---|---|---|
| Within 2 km of a line | 0.15 | 2% |
| 2 to 15 km | 0.43 | 5% |
| More than 15 km | 7.66 | 93% |
| Total | 8.24 | 100% |
How we count this
"Without night-time light" is a satellite proxy, not a measured access rate. Distances are straight lines to mapped or predicted lines. See the grid-edge atlas for the method.
Power plants and projects
Two operating power plants of 10 MW and above add up to about 125 MW, 100% of it oil. The largest is UN power station (65 MW, oil). Another 4 plants totaling about 132 MW are under construction or planned. Most of the pipeline is solar. One early-stage project, Daynile Power Plant solar farm, accounts for 42% of that, so the total says more about ambition than about what will be built soon.
One transmission project touching Somalia is in our register.
- Ethiopia-Somaliland interconnector (Jigjiga-Hargeisa-Berbera) (400 kV): pre-feasibility, expected 2030.
| Type | Operating MW | Pipeline MW |
|---|---|---|
| Oil | 125 | |
| Solar | 132 | |
| Total | 125 | 132 |
More about Somalia
Open any topic for the full text and tables.
Waste to WealthSecond life for solar and batteries
Between 2026 and 2040, about 1,900 tonnes of solar equipment and stationary batteries are expected to retire in Somalia, most of it off-grid solar kits and mini-grids. That is 0.4% of the total for the 49 countries in our second-life atlas. Eastern Africa has e-waste collection and dismantling, in Kenya and Rwanda, but no recycler for panels or lithium batteries yet, so this waste would have to travel to South Africa, mostly by sea to Durban.
| Stream | Tonnes | Share of country |
|---|---|---|
| Solar panels | 238 | 12% |
| Off-grid solar kits and mini-grids | 1,707 | 88% |
| Total | 1,945 | 100% |
| Somalia | Atlas total | Share | |
|---|---|---|---|
| Retiring solar and batteries (tonnes) | 1,945 | 507,091 | 0.4% |
| Reusable battery storage (MWh) | 0 | 4,664 | 0.0% |
| Retiring in 2030 (tonnes) | 120 | ||
| Retiring in 2035 (tonnes) | 177 | ||
| Retiring in 2040 (tonnes) | 147 |
From our second-life atlas, central case, by country. Electric vehicle batteries are modeled for the region as a whole, so they are not in these country figures.
EmissionsGrid emission factor
Each megawatt-hour generated in Somalia in 2024 came with about 0.60 tonnes of CO2. For carbon projects such as solar mini-grids, the combined margin (the usual basis for crediting) is about 0.38 tCO2/MWh. Looking ahead, our scenarios from the plants in the pipeline put the average at 0.60 tCO2/MWh in 2030 and 0.60 in 2035, depending on how many plants arrive on time (see the scenarios). We have not yet rated the quality of its data. See our grid emission factors for the method and all 49 countries.
Grid mix, 2024.
Oil and diesel 79% Solar 19% Wind 2%
| Measure | tCO2/MWh |
|---|---|
| Generated in country | 0.603 |
| Electricity used, with imports | 0.603 |
| Combined margin (for carbon projects) | 0.381 |
Tariffs and load sheddingWhat power costs here
BECO (Mogadishu)'s Retail price per kWh tariff, in force from 25 October 2026. Our utilities, tariffs and load shedding page compares 49 African countries by customer class, with what each tariff includes and load shedding since 2015.
| Measure | Value |
|---|---|
| Household (all kWh) | 0.46 USD/kWh, about US$0.460 |
| Load shedding now | No national grid; private town grids, no load shedding reports found (searched 19 Nov 2026) |
Energy charge only, at the central bank rate on 30 October 2026. Check what is included (VAT, levies, fixed charges) on the research page.
Grid consumptionWho uses the power on the grid
The UN puts the country's electricity use at about 531 GWh in 2023, an estimate. We have not found a split by customer class or an official total yet. Our grid consumption page compares sales by customer class, power use per customer and peak demand across 49 African countries.
| Measure | Value |
|---|---|
| National use, UN 2023 | 531 GWh * |
UN: UN Energy Statistics Database (UNdata). * UN estimate or a single figure from a news report.
Certificates and carbon creditsRenewable energy certificates
Somalia can issue I-RECs, the international renewable energy certificate. 2 plants are registered (1 MW) and 967 MWh of certificates have been issued. On the voluntary carbon registries it has 4 carbon credit projects, 2 of them issuing, with about 3.2 million credits issued; none is a renewable energy project. See our certificates page to compare certificates with carbon credits across the region.
| Measure | Value |
|---|---|
| I-REC status | Issuing |
| Registered plants | 2 (1 MW) |
| I-RECs issued, all years | 967 MWh |
| Carbon credit projects | 4 |
| Carbon credits issued | 3.2 million |
I-RECs: Xpansiv I-REC Registry statistics, October 2026. Carbon projects: CarbonPlan OffsetsDB (Verra, Gold Standard and other voluntary registries), data to June 2026. Article 6: UNEP Copenhagen Climate Centre Article 6 Pipeline, November 2026.
Lit but off the mapWhere the lights are and the map is not
Satellites see 158 lit places in Somalia at night. 3 are within 2 km of a mapped line, 7 are 2 to 10 km away and 148 are 10 km or more from any mapped line. Places lit far from the map point to lines the map is missing, mines and plants with their own power, or mini-grids.
The lit places off the map cover about 1,274 km² and are home to about 5,997,365 people.
| Distance | Lit places | Newly lit |
|---|---|---|
| Within 2 km of a mapped line | 3 | |
| 2 to 10 km away | 7 | 6 |
| 10 km or more | 148 | 117 |
See them on the map: the "Lit but off the map" layer of the grid-edge atlas.
Climate and carbonCarbon per new connection
The Mission 300 compact for Somalia adds about 172,800 new connections by 2030: 107,800 to the grid, 25,100 on mini-grids and 39,900 with solar home systems.
Counted with what household surveys show people use for light now (kerosene is the main light in 5% of homes without power), they avoid about 3,449 t of CO2 a year and add about 23,436 t from the power they use, a net addition of 19,987 t a year.
| Measure | Value |
|---|---|
| New connections by 2030 | 172,810 |
| CO2 avoided (t a year) | 3,449 |
| CO2 added (t a year) | 23,436 |
| Net CO2 avoided (t a year) | -19,987 |
| Net per 1,000 connections (t a year) | -115.7 |
The default methodology view and every source: carbon per connection.
From power plant to battery siteWhen the thermal plants close
Somalia has 1 coal, gas or oil plant site of 50 MW or more, with 65 MW of grid connection. None of it frees up before 2030 in our central case.
Putting solar and batteries on those connections when they free up would save about 0.8 Mt of CO2 between 2026 and 2050, worth about 3.7 times what they cost to build at the US EPA's social cost of carbon.
| Plant | Fuel | Connection (MW) | Frees up | CO2 saved 2026-2050 (Mt) |
|---|---|---|---|---|
| UN power station | Oil | 65 | 2035 | 0.8 |
Timings, cases and every site: power plant to battery site.
Waste to WealthPower from waste
Somalia's sugar mills, landfills, sewage works, factories and crop residues could make about 1 MW of power that is not built yet (central case), avoiding about 12,743 t of CO2e a year.
| Source | MW |
|---|---|
| City waste | 0.5 |
| Crop and sawmill residues | 0.7 |
| Site | What | MW |
|---|---|---|
| Mogadishu | Food and garden waste biogas | 0.5 |
Every site, costs and the method: power from waste.
Second lifeWho could use a second-life panel
Places in Somalia that could use a second-life solar panel add up to about 1,337 MWp (range 597 to 3,016): 1,271 MWp to cut generator use in towns, 41 MWp for mini-grids, 20 MWp for household systems and 3.9 MWp for 538 health facilities and 0 schools with no light at night.
Mapped by half-degree cell, with years to 2040: where the panels are needed.
E-mobilityElectric transport, per km
On Somalia's grid, an electric motorbike emits about 42 g of CO2 per km from the power it charges with, against 48 g for a petrol one (13% less).
| Vehicle | Electric | Petrol or diesel | Difference |
|---|---|---|---|
| Motorbike | 42 | 48 | -13% |
| Bus | 780 | 1,673 | -53% |
| Small car (newer petrol car) | 125 | 125 | 0% |
Life-cycle figures, a cost calculator and city air: e-mobility.
Neighbors, sources and updates
Neighboring countries
More in the EAPP grid atlas, grid-edge atlas, second-life atlas and grid emission factors, or see all countries.
Sources 12 sources
- Grid lines: OpenStreetMap contributors (ODbL), with gap-fill from the World Bank Africa electricity grid (2017).
- Power plants: Global Energy Monitor, Global Integrated Power Tracker (September 2026), with WRI and curated public project sources.
- Capacity and access: national regulators and utilities, and the Tracking SDG7 Energy Progress Report 2026.
- People without night-time light and distance to the grid: WorldPop 2020 and gridfinder (Arderne et al. 2020, CC BY 4.0), as screened in our grid-edge atlas.
- Retiring solar and batteries: our second-life atlas model (central case, regular losses), from public project registers and IRENA lifetimes.
- Emission factors: our grid emission factors (Ember, 2024).
- Lit places: NASA Black Marble night lights, compared with our mapped lines (grid-edge atlas).
- Carbon per connection: compact targets, household lighting surveys (census, MICS, DHS, MTF) and our grid emission factors.
- Thermal plant sites: Global Energy Monitor, Global Integrated Power Tracker (September 2026), and our thermal-to-storage model.
- Power from waste: FAOSTAT, Global Energy Monitor and OpenStreetMap sites, in our waste-to-energy model.
- Second-life demand: grid-edge screening, compact targets, World Bank Enterprise Surveys and health and school facility lists, in our second-life atlas.
- Transport per km: our grid emission factors and vehicle energy use; running costs from national pump prices and tariffs.
The maps are free to view. The data behind this page is available on request: email [email protected]. Lines are indicative, not for engineering or investment decisions.
What changed 3 updates
Our data is checked every month, and this page is rebuilt after each check.
- 19 November 2026 - Latest update to the EAPP grid atlas, which this page is generated from.
- 19 November 2026 - Posters updated for the 12 countries, with new A2 pairs for Djibouti, Sudan, South Sudan, Eritrea and Somalia.
- 19 November 2026 - Sudan, South Sudan, Eritrea, Somalia and Djibouti now shown in full (12 countries): their lines, substations and plants from OpenStreetMap, Global Energy Monitor, WRI and the World Bank 2017 map, and country figures from Ember (2024) and the World Bank.
Common questions about Somalia
Where can I find a map of Somalia's electricity grid?
The free EAPP grid atlas maps Somalia's high-voltage lines, substations, power plants of 10 MW and above and planned projects. Open it zoomed to Somalia.
How many people in Somalia live without electricity?
About 8.2 million people live where satellites see no electric light at night, a proxy for living without power. Of them, 7% are within 15 km of a power line.
How long is Somalia's transmission network?
About 6 km of mapped lines at 66 kV and above, mostly from OpenStreetMap.
How much power generation does Somalia have?
Operating plants of 10 MW and above add up to about 125 MW in our atlas, with about 132 MW more under construction or planned.
What is the grid emission factor for Somalia?
About 0.60 tCO2/MWh for electricity used in 2024, and 0.38 tCO2/MWh as a combined margin for carbon projects. See our grid emission factors for the method.
Can I get the data for Somalia?
Yes, on request. The maps are free to view; email [email protected] and tell us what you need it for.
 Spotted an error, or something missing on this page? Report an issue or send feedback