
West African Power Pool
Mali electricity grid and access
About 17 million people in Mali live where satellites see no electric light at night, and 56% of them live within 15 km of a power line. This page brings together what our open atlases show for Mali: about 2,382 km of high-voltage lines, 1,066 MW of power plants and the projects still to come.
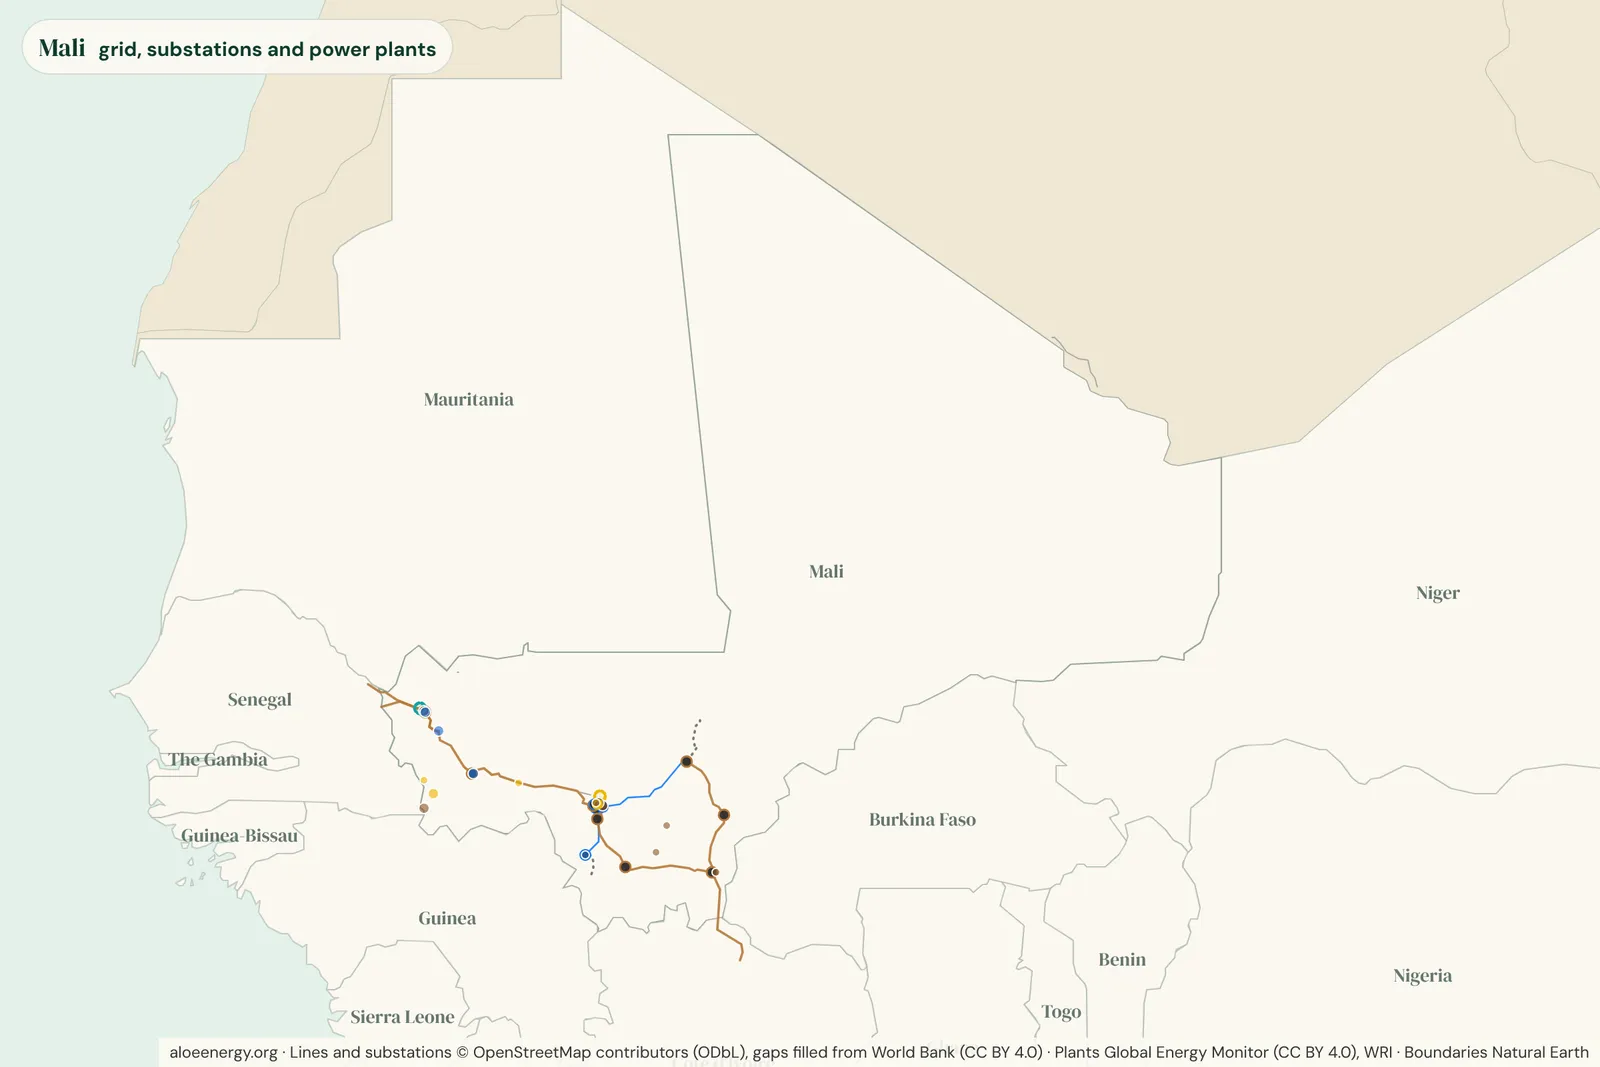
Lines, substations and demand
Mali's mapped high-voltage network runs to about 2,382 km of lines at 66 kV and above, with 14 substations. The highest voltage on the map is 220 kV, and 75% of the line length runs at 220 kV or more. About 159 km come from older World Bank (2017) maps, used where OpenStreetMap has gaps. Installed capacity was about 867 MW (GEM Sep 2026). The latest international tracking report puts access to electricity at 50% of people.
| Voltage | km |
|---|---|
| 220 kV | 1,659 |
| 132 kV | 380 |
| Voltage not recorded | 185 |
| Gap-fill from older public maps | 159 |
| Total | 2,382 |
Who lives near the grid but off it
About 17 million people in Mali, roughly 71% of the population, live where satellites see no electric light at night. Of them, 56% live within 15 km of a mapped or predicted power line: 2.5 million within 2 km, 7.3 million 2 to 15 km away, and 7.6 million farther out. The largest group lives more than 15 km from any line, where standalone solar and mini-grids are the realistic first step for years to come.
- Within 2 km: 2.5 million (14%)
- 2 to 15 km: 7.3 million (42%)
- More than 15 km: 7.6 million (44%)
See the numbers as a table
| Distance | Million people | Share |
|---|---|---|
| Within 2 km of a line | 2.47 | 14% |
| 2 to 15 km | 7.30 | 42% |
| More than 15 km | 7.62 | 44% |
| Total | 17.38 | 100% |
How we count this
"Without night-time light" is a satellite proxy, not a measured access rate. Distances are straight lines to mapped or predicted lines. See the grid-edge atlas for the method.
Power plants and projects
There are 15 operating power plants of 10 MW and above, adding up to about 1,066 MW, 43% of it oil. The largest is Manantali hydroelectric plant (200 MW, hydro). Another 12 plants totaling about 1,102 MW are under construction or planned, 300 MW of them under construction. Most of the pipeline is solar. The largest plant under construction is Sanankoroba 200MW solar farm (200 MW, solar).
Four transmission projects touching Mali are in our register.
- Guinea-Mali 225 kV interconnection (PIEGM) (225 kV): under construction, expected 2028.
- Bamako North 225 kV loop (225 kV): financed, expected 2029.
- Mauritania-Mali 225 kV interconnection (PIEMM) (225 kV): under construction, expected 2030.
- Ghana-Burkina Faso-Mali 330 kV (Bolgatanga-Bobo-Dioulasso-Sikasso) (330 kV): feasibility, expected 2031.
| Type | Operating MW | Pipeline MW |
|---|---|---|
| Hydro | 450 | 42 |
| Oil | 454 | |
| Solar | 162 | 909 |
| Wind | 151 | |
| Total | 1,066 | 1,102 |
More about Mali
Open any topic for the full text and tables.
Waste to WealthSecond life for solar and batteries
Between 2026 and 2040, about 5,300 tonnes of solar equipment and stationary batteries are expected to retire in Mali, most of it solar panels. That is 1.0% of the total for the 49 countries in our second-life atlas. Up to 43 MWh of retired batteries could be tested and reused as storage, for example in solar home systems, shops and mini-grids (0.9% of the atlas total). West and Central Africa have no recycler for panels or lithium batteries yet (one is planned in Ogun State, Nigeria), only e-waste collection in Accra, Lagos and Dakar and some lead-acid smelters, so for now this waste would be shipped abroad from the nearest seaport. Reuse comes first: Spiro already puts retired swap batteries to work as storage.
| Stream | Tonnes | Share of country |
|---|---|---|
| Solar panels | 3,054 | 58% |
| Off-grid solar kits and mini-grids | 1,705 | 32% |
| Batteries | 549 | 10% |
| Total | 5,309 | 100% |
| Mali | Atlas total | Share | |
|---|---|---|---|
| Retiring solar and batteries (tonnes) | 5,309 | 507,091 | 1.0% |
| Reusable battery storage (MWh) | 43 | 4,664 | 0.9% |
| Retiring in 2030 (tonnes) | 171 | ||
| Retiring in 2035 (tonnes) | 744 | ||
| Retiring in 2040 (tonnes) | 726 |
From our second-life atlas, central case, by country. Electric vehicle batteries are modeled for the region as a whole, so they are not in these country figures.
EmissionsGrid emission factor
Each megawatt-hour generated in Mali in 2024 came with about 0.61 tonnes of CO2. For carbon projects such as solar mini-grids, the combined margin (the usual basis for crediting) is about 0.47 tCO2/MWh. Looking ahead, our scenarios from the plants in the pipeline put the average at 0.51 to 0.56 tCO2/MWh in 2030 and 0.51 to 0.56 in 2035, depending on how many plants arrive on time (see the scenarios). We have not yet rated the quality of its data. See our grid emission factors for the method and all 49 countries.
Grid mix, 2024.
Oil and diesel 81% Hydro 15% Solar 3% Bioenergy 1%
| Measure | tCO2/MWh |
|---|---|
| Generated in country | 0.614 |
| Electricity used, with imports | 0.614 |
| Combined margin (for carbon projects) | 0.465 |
Tariffs and load sheddingWhat power costs here
Our utilities, tariffs and load shedding page compares 49 African countries by customer class, with what each tariff includes and load shedding since 2015.
| Measure | Value |
|---|---|
| Load shedding now | Improved in Bamako by Sep 2026; regions still erratic (Mopti about five hours a day) |
Energy charge only, at the central bank rate on 30 October 2026. Check what is included (VAT, levies, fixed charges) on the research page.
Grid consumptionWho uses the power on the grid
Low-voltage customers, households and small businesses together, bought 62% of the electricity sold, by the latest official figures. A low-voltage connection used about 84 kWh a month. Our grid consumption page compares sales by customer class, power use per customer and peak demand across 49 African countries.
| Measure | Value |
|---|---|
| Low voltage (households and small businesses) | 62% |
| Industry | 38% |
| Sold to customers (official) | 1,474 GWh |
| National use, UN 2023 | 4,065 GWh * |
| Use per low-voltage connection | about 84 kWh a month |
| Peak demand | 386 MW |
Sales and peak: EDM-SA (interconnected grid and isolated centers), from EDM-SA, Rapport annuel d'activites 2024 (published Jan 2026) (calendar 2024). UN: UN Energy Statistics Database (UNdata). * UN estimate or a single figure from a news report.
Certificates and carbon creditsRenewable energy certificates
Mali cannot issue I-RECs, the international renewable energy certificate, yet. On the voluntary carbon registries it has 14 carbon credit projects, 5 of them issuing, with about 1.7 million credits issued; none is a renewable energy project. Under the Paris Agreement it has 2 activities approved for the UN's new crediting mechanism. See our certificates page to compare certificates with carbon credits across the region.
| Measure | Value |
|---|---|
| I-REC status | Not approved |
| Registered plants | - |
| I-RECs issued, all years | - |
| Carbon credit projects | 14 |
| Carbon credits issued | 1.7 million |
I-RECs: Xpansiv I-REC Registry statistics, October 2026. Carbon projects: CarbonPlan OffsetsDB (Verra, Gold Standard and other voluntary registries), data to June 2026. Article 6: UNEP Copenhagen Climate Centre Article 6 Pipeline, November 2026.
Lit but off the mapWhere the lights are and the map is not
Satellites see 437 lit places in Mali at night. 99 are within 2 km of a mapped line, 51 are 2 to 10 km away and 287 are 10 km or more from any mapped line. Places lit far from the map point to lines the map is missing, mines and plants with their own power, or mini-grids.
The lit places off the map cover about 1,758 km² and are home to about 2,298,213 people.
| Distance | Lit places | Newly lit |
|---|---|---|
| Within 2 km of a mapped line | 99 | |
| 2 to 10 km away | 51 | 46 |
| 10 km or more | 287 | 248 |
See them on the map: the "Lit but off the map" layer of the grid-edge atlas.
Water and climate riskHydro and drought
Hydro is 42% of the operating power plants in Mali and made 15% of its electricity in 2024.
A dry year that takes a fifth of hydro output would cost about 30 MW on average over the year, and a severe drought (two fifths, as Zambia saw in 2024) about 60 MW.
The limit on the import lines is not published, so we cannot say how much of a shortfall imports could cover.
| Measure | Value |
|---|---|
| Hydro in operating capacity | 42% |
| Operating hydro (MW) | 456 |
| Hydro in 2024 generation | 15% |
| Dry year, average MW lost | 30 |
| Severe drought, average MW lost | 60 |
Method and all countries: hydro dependence and drought exposure.
Power pricesWhat power plants are paid
We found 1 signed or awarded electricity price for Mali, at US$119 per MWh in 2025 dollars. Each is what a buyer agreed to pay a power plant, with its source; some deals never reached operation.
| Deal | Type | Year | Status | US$ per MWh (2025) |
|---|---|---|---|---|
| Phanes Energy Mali solar IPP - PPA with EDM-SA | Solar PV | 2020 | signed | 119 |
All deals, market prices and a planning calculator: power prices.
Climate and carbonCarbon per new connection
The Mission 300 compact for Mali adds about 1.03 million new connections by 2030: 0.64 million to the grid, 0.15 million on mini-grids and 0.24 million with solar home systems.
Counted with what household surveys show people use for light now (kerosene is the main light in 5% of homes without power), they avoid about 20,492 t of CO2 a year and add about 141,732 t from the power they use, a net addition of 121,240 t a year.
| Measure | Value |
|---|---|
| New connections by 2030 | 1,026,760 |
| CO2 avoided (t a year) | 20,492 |
| CO2 added (t a year) | 141,732 |
| Net CO2 avoided (t a year) | -121,240 |
| Net per 1,000 connections (t a year) | -118.1 |
The default methodology view and every source: carbon per connection.
From power plant to battery siteWhen the thermal plants close
Mali has 2 coal, gas or oil plant sites of 50 MW or more, with 190 MW of grid connection. None of it frees up before 2030 in our central case.
| Plant | Fuel | Connection (MW) | Frees up |
|---|---|---|---|
| Sirakoro power station | Oil | 100 | 2058 |
| Kayes power station | Oil | 90 | 2053 |
Timings, cases and every site: power plant to battery site.
Waste to WealthPower from waste
Mali's sugar mills, landfills, sewage works, factories and crop residues could make about 73 MW of power that is not built yet (central case), avoiding about 215,585 t of CO2e a year.
| Source | MW |
|---|---|
| Sugar mills and farms | 9.0 |
| Landfill gas and biogas | 0.6 |
| Industrial waste heat | 2.3 |
| City waste | 0.2 |
| Crop and sawmill residues | 60.9 |
| Site | What | MW |
|---|---|---|
| Sukala Dougabougou | Sugar mill boiler upgrade | 4.5 |
| Sukala Siribala | Sugar mill boiler upgrade | 4.5 |
| Diamond Cement Mali Bafoulabé Cement Plant | Cement kiln waste heat | 2.3 |
Every site, costs and the method: power from waste.
Second lifeWho could use a second-life panel
Places in Mali that could use a second-life solar panel add up to about 1,233 MWp (range 546 to 2,768): 1,096 MWp to cut generator use in towns, 89 MWp for mini-grids, 43 MWp for household systems and 6.1 MWp for 1,160 health facilities and 11 schools with no light at night.
Mapped by half-degree cell, with years to 2040: where the panels are needed.
E-mobilityElectric transport, per km
On Mali's grid, an electric motorbike emits about 42 g of CO2 per km from the power it charges with, against 48 g for a petrol one (11% less).
| Vehicle | Electric | Petrol or diesel | Difference |
|---|---|---|---|
| Motorbike | 42 | 48 | -11% |
| Bus | 795 | 1,673 | -52% |
| Small car (newer petrol car) | 127 | 125 | +2% |
Life-cycle figures, a cost calculator and city air: e-mobility.
Neighbors, sources and updates
Neighboring countries
Senegal Niger Mauritania Guinea Côte d'Ivoire Burkina Faso
More in the WAPP grid atlas, grid-edge atlas, second-life atlas and grid emission factors, or see all countries.
Sources 14 sources
Show the full list 14 items
- Grid lines: OpenStreetMap contributors (ODbL), with gap-fill from the World Bank Africa electricity grid (2017).
- Power plants: Global Energy Monitor, Global Integrated Power Tracker (September 2026), with WRI and curated public project sources.
- Capacity and access: national regulators and utilities, and the Tracking SDG7 Energy Progress Report 2026.
- People without night-time light and distance to the grid: WorldPop 2020 and gridfinder (Arderne et al. 2020, CC BY 4.0), as screened in our grid-edge atlas.
- Retiring solar and batteries: our second-life atlas model (central case, regular losses), from public project registers and IRENA lifetimes.
- Emission factors: our grid emission factors (Ember, 2024).
- Lit places: NASA Black Marble night lights, compared with our mapped lines (grid-edge atlas).
- Hydro and drought: our hydro exposure analysis (plants from our grid atlases; generation from Ember, corrected with regulator figures).
- Power prices: our power prices table (signed and awarded deals, with a source for each).
- Carbon per connection: compact targets, household lighting surveys (census, MICS, DHS, MTF) and our grid emission factors.
- Thermal plant sites: Global Energy Monitor, Global Integrated Power Tracker (September 2026), and our thermal-to-storage model.
- Power from waste: FAOSTAT, Global Energy Monitor and OpenStreetMap sites, in our waste-to-energy model.
- Second-life demand: grid-edge screening, compact targets, World Bank Enterprise Surveys and health and school facility lists, in our second-life atlas.
- Transport per km: our grid emission factors and vehicle energy use; running costs from national pump prices and tariffs.
The maps are free to view. The data behind this page is available on request: email [email protected]. Lines are indicative, not for engineering or investment decisions.
What changed 4 updates
Our data is checked every month, and this page is rebuilt after each check.
- 19 November 2026 - Latest update to the WAPP grid atlas, which this page is generated from.
- 19 November 2026 - Latest update to the grid-edge atlas, which this page is generated from.
- 19 November 2026 - Lit but off the map now covers all 43 countries (Mali, Guinea-Bissau, Cabo Verde and Equatorial Guinea added, with their OpenStreetMap lines), and people around Chad's lit places now come from the building-based layer: 20,300 places 2 km or more from a mapped line, about 106 million people. The free download is now version 2: 20,647 places in 43 countries. Road distances for Mali, Guinea-Bissau, Cabo Verde, Equatorial Guinea, Djibouti and Comoros now feed the chance bands.
- 19 November 2026 - Mali, Guinea-Bissau, Cabo Verde and Equatorial Guinea added: 43 countries. Every country now counts people from buildings: Chad moves from WorldPop to Microsoft building footprints and Mali uses Overture Maps buildings, because Google's building data has none there. Headline: 633 million people without night-time light (was 617 M), 499 million of them within 15 km of a line (was 490 M). The lit-but-off-the-map layer still covers the first 39 countries.
Common questions about Mali
Where can I find a map of Mali's electricity grid?
The free WAPP grid atlas maps Mali's high-voltage lines, substations, power plants of 10 MW and above and planned projects. Open it zoomed to Mali.
How many people in Mali live without electricity?
About 17 million people live where satellites see no electric light at night, a proxy for living without power. Of them, 56% are within 15 km of a power line.
How long is Mali's transmission network?
About 2,382 km of mapped lines at 66 kV and above, mostly from OpenStreetMap, with older public maps filling gaps.
How much power generation does Mali have?
Operating plants of 10 MW and above add up to about 1,066 MW in our atlas, with about 1,102 MW more under construction or planned.
What is the grid emission factor for Mali?
About 0.61 tCO2/MWh for electricity used in 2024, and 0.47 tCO2/MWh as a combined margin for carbon projects. See our grid emission factors for the method.
Can I get the data for Mali?
Yes, on request. The maps are free to view; email [email protected] and tell us what you need it for.
 Spotted an error, or something missing on this page? Report an issue or send feedback